Primer: AISC 360-16 Chapter J Connection Design
“Primers” are my personal notes on various technical topics in structural engineering. Building codes are dense and voluminous, sometimes written in legalese rather than in sentences that can be easily understood. I write these “Primer” so I can gather, organize, and condense technical topics I encounter as an engineer. Please understand I made these for myself. Reader discretion is advised. No warranty is expressed or implied by me on the validity of the information presented herein.
- 1.0 Fundamentals
- 2.0 Demands - Bolted Connections
- 3.0 Demands - Welded Connections
- 4.0 Capacity - Base Material
- 4.1 Material Properties
- 4.2 Shear Yielding and Rupture
- 4.3 Tension Yielding and Rupture
- 4.4 Block Shear of Welded Connections
- 4.5 Flexure
- 4.6 Compression
- 4.7 Local Concentrated Load - Flange Bending
- 4.8 Local Concentrated Load - Web Local Yielding
- 4.9 Local Concentrated Load - Web Local Crippling
- 4.10 Local Concentrated Load - Web Sidesway Buckling
- 4.11 Local Concentrated Load - Web Buckling
- 4.12 Local Concentrated Load - Concrete Bearing
- 5.0 Capacity - Bolted Connections
- 6.0 Capacity - Welded Connections
1.0 Fundamentals
1.1 Overview
Connection design is simply the creation of a viable load path between two base materials. Through this load path, the designer must ensure all failure modes (limit states) are accounted for. Each limit state has a corresponding capacity, and the goal is to ensure Capacity > Demand in all cases.
 Figure 1.11: Load Path Through Connection
For example, take a single-plate shear connection (shear tab) which is shown in the figure below. The gravity load must flow from the girder to the supporting column.
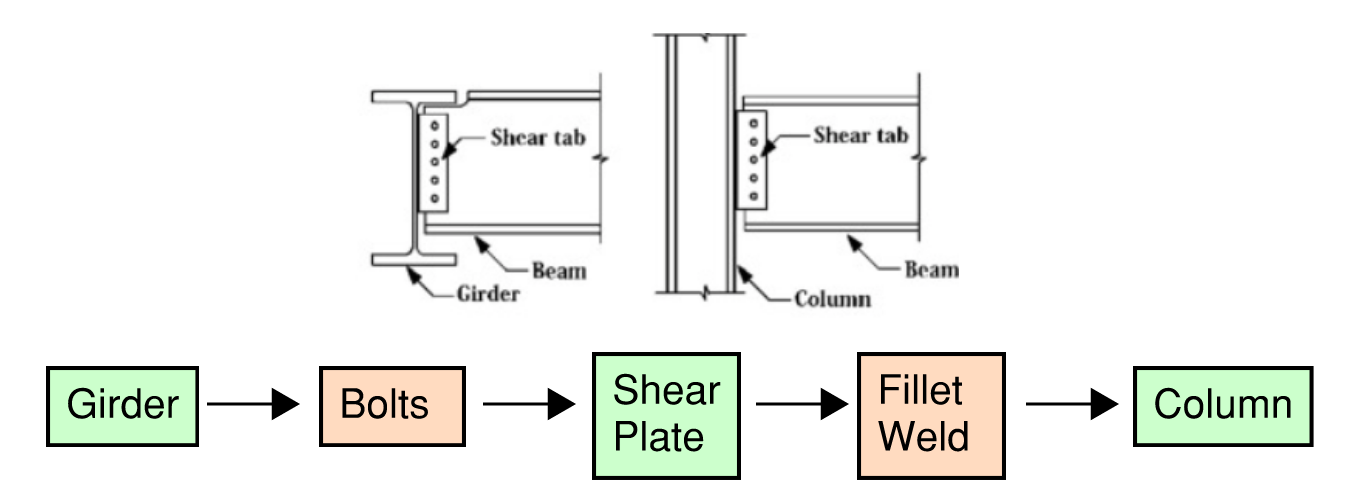 Figure 1.12: Shear Tab Connection
Each step of the load path must be carefully examined (e.g. the bolts can’t be too small, the plates can’t be too thin, etc). There are also detailing and serviceability considerations that we will also discuss later. For a simple shear tab connections, the following limit states must be checked:
- Bolt shear
- Bolt bearing and tear out on the plate
- Plate shear yielding
- Plate shear rupture
- Block shear
- Weld rupture
Like a chain link, the capacity of the overall connection is equal to the lowest capacity of all relevant limit states. In general, there are two approaches to designing connections:
- Design: Calculate an overall connection capacity (one number) based on all applicable limit states. This number can be used repeatedly later on for any demand.
- Analysis: Calculate both capacity and demand. Given a connection and applied loads, calculate DCR of every single limit state.
1.2 Focus on Limit States
Broadly speaking, steel connections can be categorized into 4 categories:
- Tension connection
- Compression connection
- Shear connection (flexible enough to avoid transferring moment)
- Moment connection (partial restraint & full restraint)
 Table 1.21: Different Types of Connections
Most structural steel connections are standardized with well-formulated design procedures. Often, a connection type is completely tabulated such that the engineer does not need to do any calculation whatsoever. This is convenient for experienced engineers but pedagogically harmful for new engineers.
Rather than focusing on one specific connection type, it is more productive and useful to understand the limit states; as this knowledge is transferable to all connection types. Most connection limit states are presented in Section J of AISC 360-16.
1.3 Demand And Capacity
The foundation of structural design is to ensure Capacity > Demand, or that the demand-capacity-ratio (DCR) is less than 1.0. This article will be in LRFD. In the equation below, the subscript “u” is used to denote “ultimate” demand, and the subscript “n” is used to denote “nominal” capacity.
\[\phi R_n \geq R_u\] \[DCR = \frac{demand}{capacity} =\frac{R_u}{\phi R_n} \leq 1.0\]We will look at connection design through the lens of capacity and demand, and you will undoubtedly hear me use these two words again and again. Strength limit states are checked with factored loads, whereas serviceability limit states are checked with nominal loads.
Here are the sections that follows:
- Section 2.0 - Determining Demands of Bolt Groups
- Section 3.0 - Determining Demands of Welds
- Section 4.0 - Capacity of Base Material
- Section 5.0 - Capacity of Bolts
- Section 6.0 - Capacity of Welds
2.0 Demands - Bolted Connections
2.1 General Information
Demands on the members (base material) are the stress resultants we often see in structural engineering.
- \(P_{u}\) - axial demand
- \(T_{u}\) - torsion demand
- \(V_{uy}\) - shear demand along y (coupled with Mx)
- \(M_{ux}\) - major-axis moment demand
- \(V_{ux}\) - shear demand along x (coupled with My)
- \(M_{uy}\) - minor-axis moment demand
Let’s clarify sign conventions before we go further.
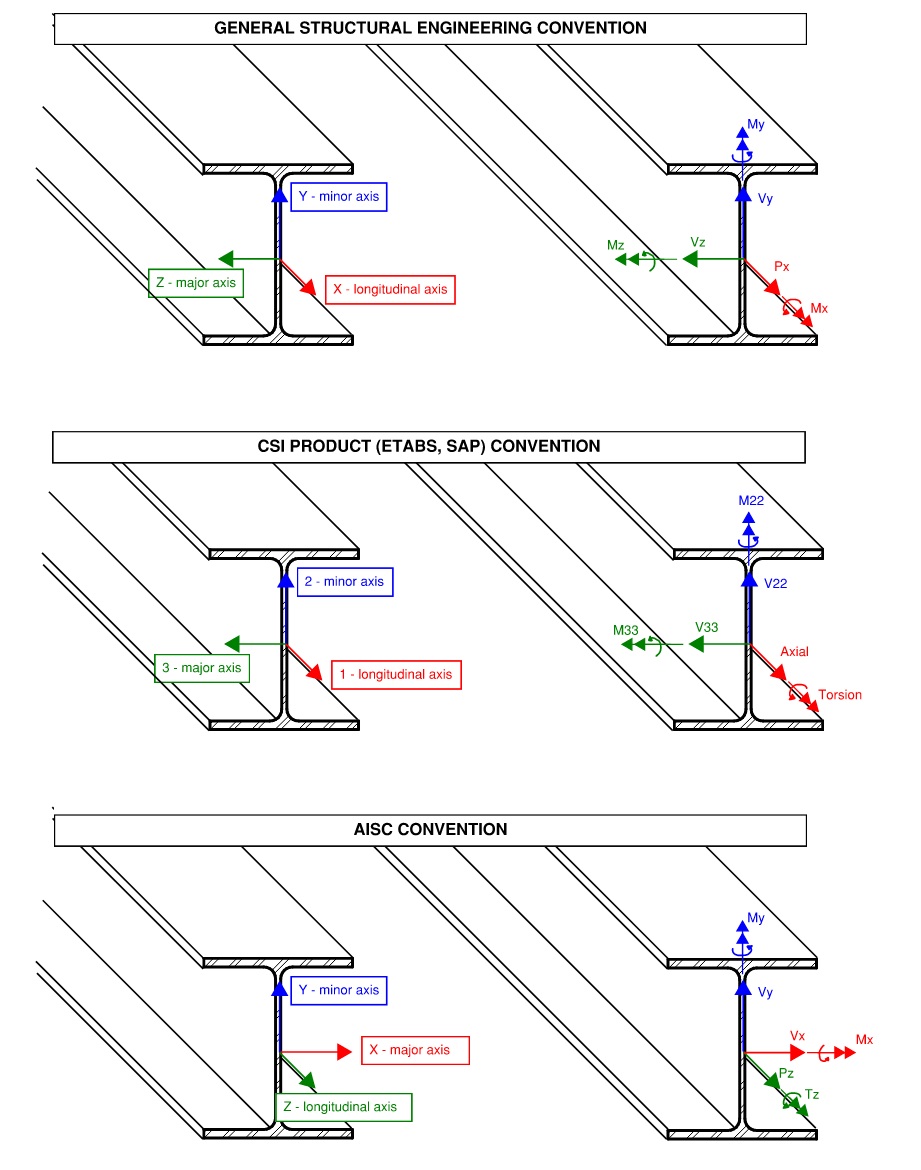 Figure 2.11: Common Sign Conventions
The first sign convention is the most common for general analysis. The second sign convention is unique to CSI products (ETABS, SAP) that is essentially a renaming of the first (x=1, y=2, z=3). These conventions are great for member-level analysis. However, notice that if you were particularly concerned with a member cross-section, it is awkward to work with a z-axis that points to the left.
AISC adopts a unique sign convention where the x-axis rotates from being the longitudinal axis along member length to being the major section axis. We will use the AISC sign convention for the rest of this primer. Note that all three sign conventions follows the right-hand rule.
2.2 Elastic Method
The transfer of member forces onto a bolt group can be simple. For example, applying 99 kips of concentric shear on 3 bolts, we know intuitively that each bolt takes about 99/3 = 33 kips. (This isn’t technically true but it’s good enough for now).
But what about a group of bolts arranged in an unique way? With Torsion? With Out-of-plane moment? How do you convert several different demands on a bolt group to the individual bolts? It’s clear that we need a closer examination.
A bolt group can take shear, moment, and torsion. However, a single bolt can only take shear or tension. Moment and torsion demand on a bolt group must be translated to a local tension or shear.
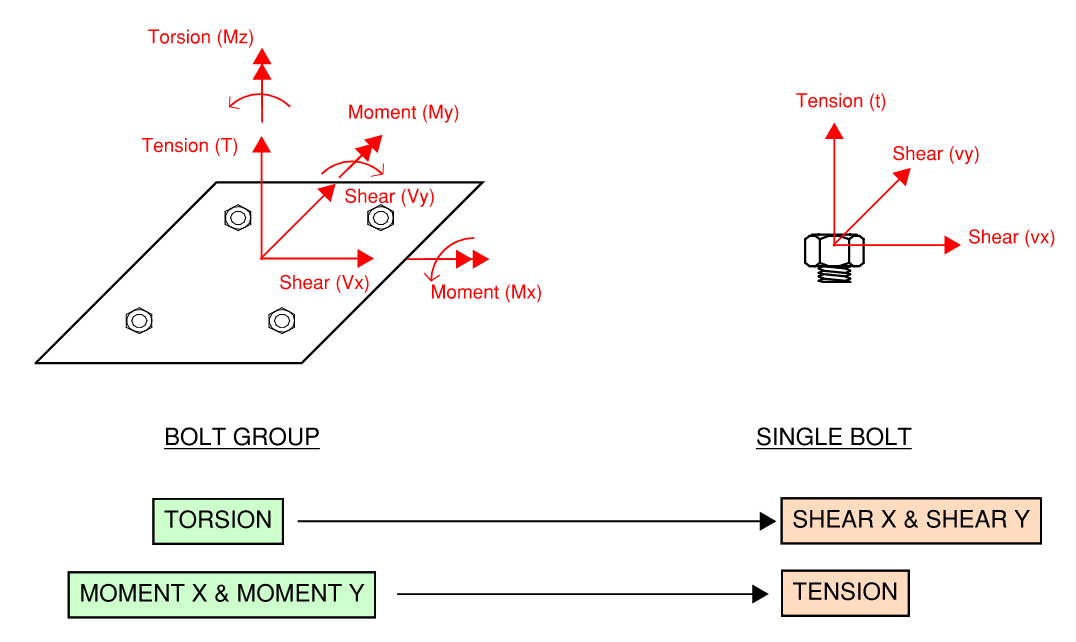 Figure 2.21: Demand on Bolts and Bolt Groups
Bolt Group Geometric Properties
Before we discuss how to calculate bolt demands, here are some useful geometric properties that will come in handy later. Bolt groups are like sections, in that they have geometric properties like centroids and moment-of-inertias.
Centroid:
\[\bar{x} = \frac{\sum x_i}{N_{bolts}}\] \[\bar{y} = \frac{\sum y_i}{N_{bolts}}\]Moment of inertia about x and y axis:
\[I_x = \sum (y_i - \bar{y})^2\] \[I_y = \sum (x_i - \bar{x})^2\]Polar moment of inertia:
\[I_z = I_x + I_y\]Product moment of inertia (equal to zero at principal axis):
\[I_{xy} = \sum (x_i - \bar{x})(y_i - \bar{y})\]Concentric Shear and Concentric Tension
First the simplest case of concentric shear and tension. The resulting demand on individual bolts is simply total force divided by number of bolts. The assumption of equal strain is actually not entirely true, but sufficient for design purposes. For connections that are sufficiently long along direction of applied shear, AISC provides reduction factors to account for uneven distribution of forces.
\[v_i = \frac{V_u}{N_{bolts}}\] \[t_i = \frac{T_u}{N_{bolts}}\] Figure 2.22: Concentric Shear and Tension Demand on Bolt Group
In-Plane Torsion
In plane torsion is converted to additional shear on the individual anchors. The x and y components, and well as the resultant is shown below.
\[v_{tx} = \frac{M_z (y_i - \bar{y})}{I_z}\] \[v_{ty} = \frac{-M_z (x_i - \bar{x})}{I_z}\] \[v_{t} = \sqrt{v_{tx}^2 + v_{ty}^2}\]The equations above should be very familiar. They’re identical to the torsion shear stress equations for beam sections (\(\tau = Tc/J\)). Essentially, bolt force varies linearly radiating from the centroid. Bolts furthest away from the centroid naturally takes more force.
The example below shows 100 kip.in of torque applied to a group of 4 bolts arranged in a 6”x6” square. Note how the resisting shear vector revolves around the centroid where the torque is applied. Each bolt is 4.24 in away from centroid (\(4.24\times5.9\times4 = 100 k.in\)). The demand and reactions are in equilibrium.
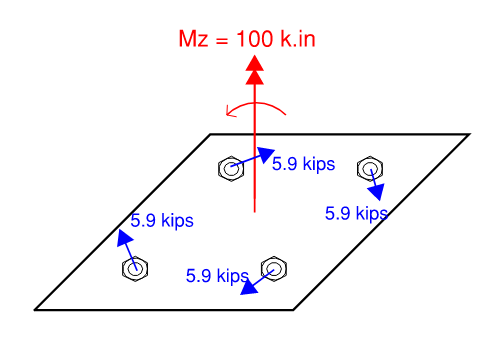 Figure 2.23: Torsion Demand on Bolt Group
Out-of-Plane Moment
There are several methods available for calculating tension due to out-of-plane moment (overturning). We will discuss two methods here.
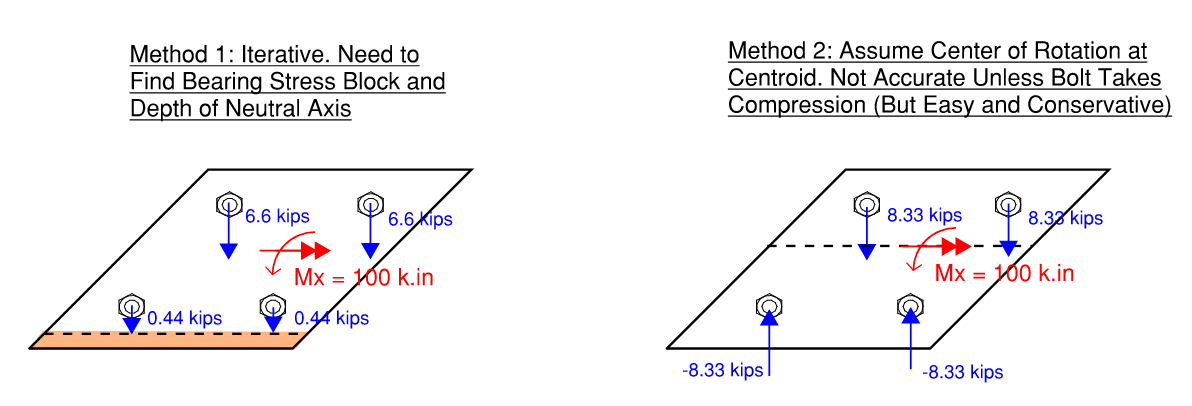 Figure 2.24: Moment Demand on Bolt Group
Let’s talk about the second method because it is simpler but quite conservative. The tension on the bolts can be easily calculated with the equation below. Again, they’re essentially the same as equation for flexural stress on beam sections (i.e. \(\sigma = Mc/I\)).
\[t_i = \frac{M_{ux} y_i}{I_x} + \frac{M_{uy} x_i}{I_y}\]The more rows of bolt you have, the more conservative the number above becomes. This is because we are systematically underestimating the internal lever arm available to the bolts in resisting the moment. This brings us to the first method.
The first method is more representative of what actually happens. However, it is more difficult to use as neutral-axis depth has to be found through some iterative or root-finding procedure. A rectangular bearing stress block is usually assumed for concrete, and a triangular bearing stress block is usually assumed for steel.
Let \(d_i\) be the distance from compression resultant (pivot point which is unknown) to the bolt location, then the tension demand for the bolt furthest from pivot point is:
\[t_{max} = \frac{M_{u}}{\sum d_i^2 / d_{max}}\]The tension demand in the other bolts can be determined in proportion to their distance to the pivot point.
\[t_i = \frac{d_i}{d_{max}} \times T_{max}\]Alternatively, we can set \(T_{max}\) equal to the tension capacity of the bolt and back-calculate \(M_u\) which is equal to the overall connection moment capacity.
Let’s do an example. In the figure above, we have a 6”x6” arrangement of bolt centered on a 8”x8” plate.
- First method: If we were to assume pivot point is about 0.1d (0.8”) from extreme compression fiber, two bolts will be 0.2” away, and the other two bolts will be 6.2” away: \(t_{max} = 100 (6.2) / (2(6.2)^2 + 2(0.2)^2) = 8.02 kips\)
- With a more sophisticated analysis, we can determine that the neutral axis is around 1.5” away from compression fiber. Two of the bolts are actually ineffectual. The actual tension demand is around 7.7 kips
- Second method: Size of bearing plate doesn’t matter. \(Ix=\sum (y_i - \bar{y})^2 = 4(3)^2 = 36\), \(t_{max} = 100(3)/36 = 8.3 kips\)
Principle of Superposition
Putting it all together, what if you had a connection that is experiencing multiple type of demands (e.g. \(M_z + M_x + M_y + Vx + Vy + T\)). Now we arrive at one of the best feature of the elastic method: Principle of Superposition - demands can be superimposed (added) together. In other words, we can look at each action separately, then add them together at the end.
A few caveats about superposition.
- The key assumption of elastic method is that rotational and translational actions are decoupled and do not influence each other. This is technically not true and result in conservative results. Elastic method is good enough for design purposes. Should we require greater accuracy, the instant center of rotation (ICR) method might be better suited (although more complicated to apply)
- For biaxial moment with method 1, bolt tension demands is NOT the linear combination of results from two arbitrarily selected basis (that can be conveniently added together). We instead need to find a diagonally oriented neutral axis which makes this method impossible to do by hand. Note the orientation of neutral axis and moment vector are rarely aligned.
- For biaxial moment with method 2, bolt tension demands due to moment can only be added if it’s about the principal axes (which is usually the case for rectangular arrangement of bolts). Otherwise, we need to convert the applied moment vector to its component parts with respect to the principal axes. The orientation of principal axes can be found using Mohr’s circle.
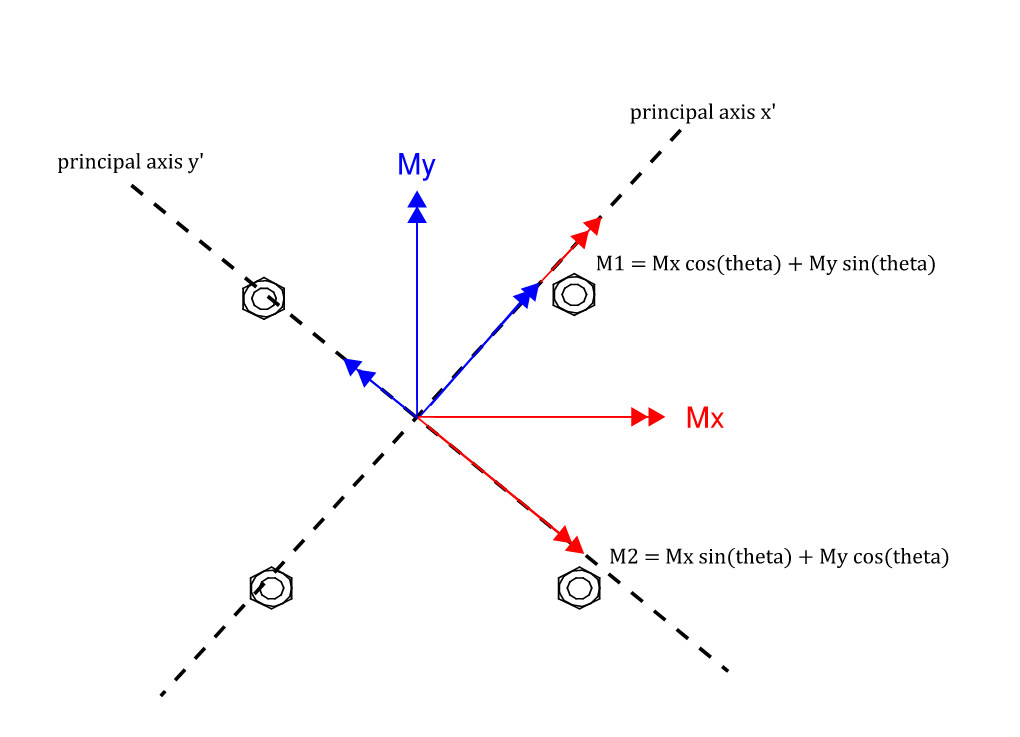
2.3 Instant Center of Rotation Method
Theoretical Background
A less conservative way of determining bolt forces is through the Instant Center of Rotation (ICR) method. The underlying theory is illustrated in the figure below.
In short, when a bolt group is subjected to combined in-plane force and torsion, the bolt force and applied force vectors revolve around an imaginary center. The ICR method is conceptually simple, but identifying the ICR location is no small task and will require iteration.
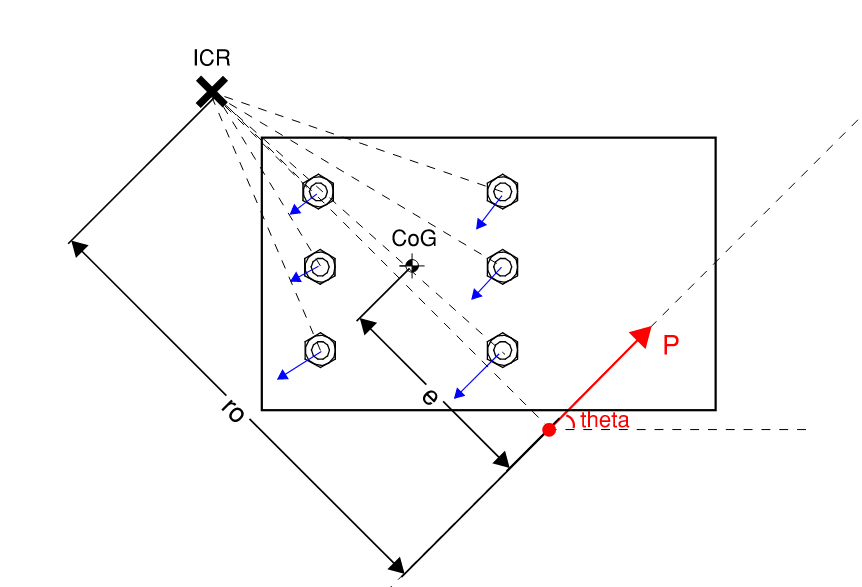 Figure 2.31: Illustration of Instant Center of Rotation
Rather than assuming elasticity and using geometric properties to determine bolt forces, we assume the bolt furthest from ICR has a deformation of 0.34”, other bolts are assumed to have linearly varying deformation based on its distance from ICR (varying from 0” to 0.34”). We can then determine the corresponding force using the force-deformation relationship below.
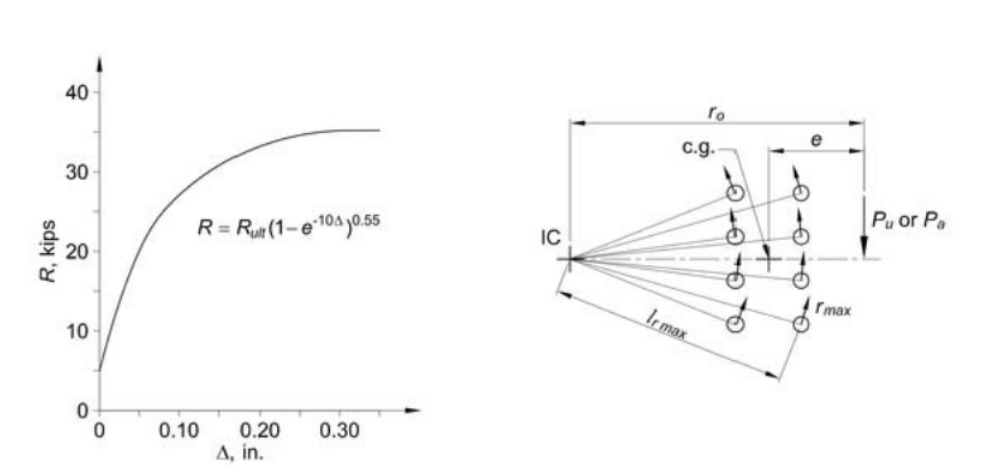 Figure 2.32: Force Deformation Relationship of Bolt Based on Experimental Testing
Assuming the location of ICR has been correctly identified, equilibrium should hold.
\[\sum F_x = 0 = P_x -\sum R_{ix}\] \[\sum F_y = 0 = P_y -\sum R_{iy}\] \[\sum M = 0 = M_z -\sum m_i\]Compared to the elastic method, the ICR method differs in three key ways:
- Rather than looking at DCR on the individual bolt level, ICR method provides an overall connection capacity. First, the applied load (Px, Py, Mz) is converted into an equivalent eccentricity and orientation, then a coefficient (C) is determined which is then multiplied by the bolt capacity to get the overall connection capacity.
- ICR method is more accurate and less conservative because it allows for plastic deformation of bolts. An appropriate analogy would be how the plastic section modulus (Zx) is larger than elastic section modulus (Sx). Technically, the elastic method also has a center about which bolt force vectors revolve. But because everything is linear, we can skip the force-deformation relationship and calculate forces from geometric properties like moment of inertia and polar moment of inertia.
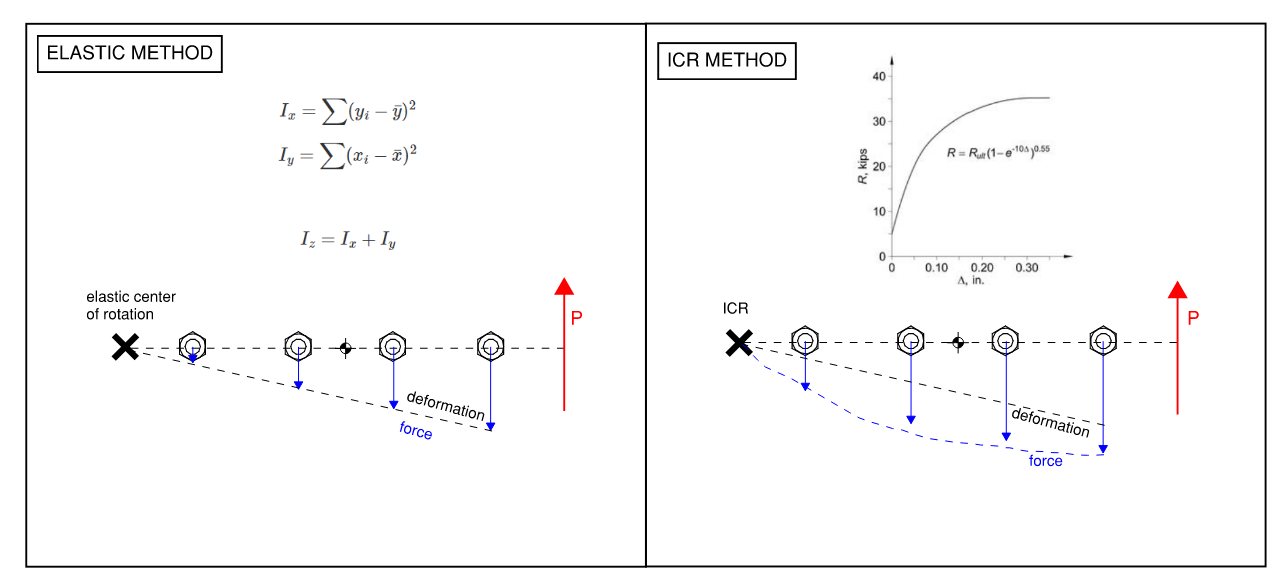 Figure 2.33: ICR Design Table in AISC Steel Construction Manual
- Unlike the elastic method, ICR method is not practical to do by hand as the location of ICR must be determined iteratively. There are design tables available in the steel construction manual. Generally the ICR method is more of a black-box.
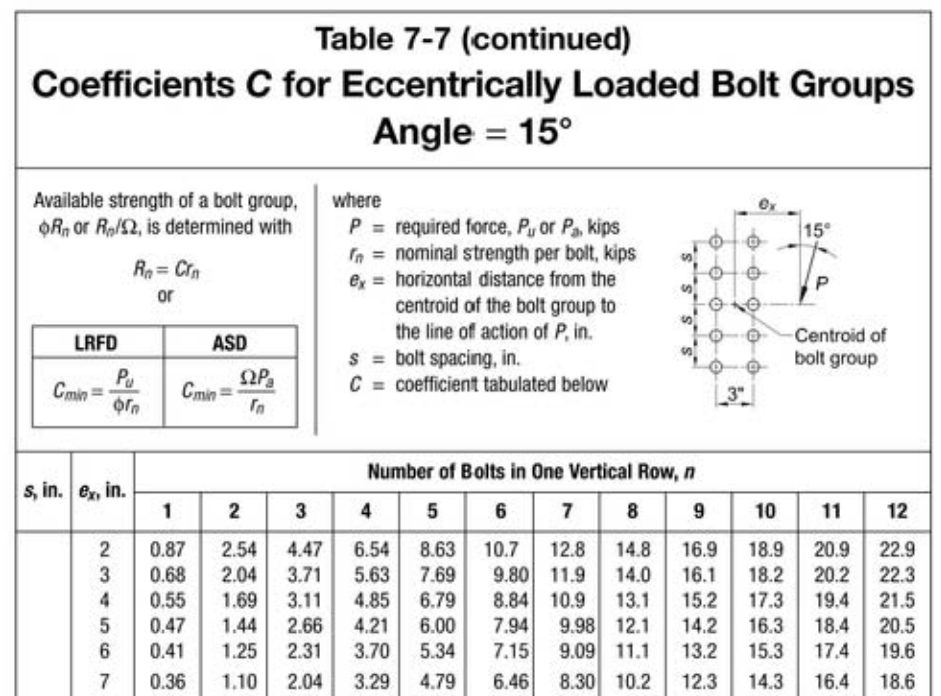 Figure 2.34: Elastic Method vs. ICR Method
Derivation
The derivations will follow AISC notations which is somewhat different from the notations from our previous chapters. Most notably, we will use \(P\) to denote applied force instead of \(V\), and \(R\) to denote in-plane bolt force instead of \(v\).
Suppose we know the exact location of ICR, first let’s calculate the applied moment with respect to this new center.
\[M_p = P \times r_o\]The maximum bolt deformation of 0.34” occurs at the bolt furthest from ICR, the other bolts have deformation varying linearly between 0 to 0.34 based on its distance to the ICR (\(d_i\))
\[\Delta_{max} = 0.34\] \[\Delta_i = 0.34 \frac{d_i}{d_{max}}\]Next, we can calculate individual bolt forces using the following force-deformation relationship:
\[R_i = (1-e^{-10\Delta_i})^{0.55} \times R_{max}\]Now, we can calculate the reactive moment contributions from each bolt:
\[M_i = R_i \times d_i\] \[M_i = R_{max} (1-e^{-10\Delta_i})^{0.55} \times d_i\] \[\sum M_i = R_{max} \times \sum (1-e^{-10\Delta_i})^{0.55} d_i\]Apply moment equilibrium and rearrange for P:
\[M_{applied} = M_{resisting}\] \[M_p = \sum M_i\] \[P \times r_o = R_{max} \times \sum (1-e^{-10\Delta_i})^{0.55} d_i\] \[P = R_{max} \times \frac{\sum (1-e^{-10\Delta_i})^{0.55} d_i}{r_o}\]Let the second term be the ICR coefficient C. You can think of C as simply a ratio between maximum bolt force and applied force
\[P = R_{max} \times C\] \[C = \frac{\sum (1-e^{-10\Delta_i})^{0.55} d_i}{r_o}\]Set \(R_{max}\) equal to the bolt capacity and back-calculate the connection capacity:
\[R_{max} = R_{capacity}\] \[P_{capacity} = R_{capacity} \times C\]
Notes:
- Despite a nonlinear bolt force-deformation, the relationship between max bolt force (\(R_{max}\)) and applied force (\(P\)) is linear. In other words, if applied force doubles, so does maximum bolt force, and vice versa. Embedded in this is the assumption that eccentricity (e = Mz / P) will remain constant
- If we substitute 0.34 into the exponential function above, we get 0.9815 as there’s a horizontal asymptote and we will never reach 1.0 exactly. We can make a simple adjustment to our “C” equation if we desire. Note that AISC does NOT make this adjustment as it is more conservative as max bolt-force is \(0.9815R_{max}\), effectively capping our DCR to 98%.
Brandt's Method
When the load orientation is completely horizontal or vertical, the ICR location reside on a line connecting CoG and ICR (this covers most cases). However, when the load orientation isn’t 0 or 90 degrees, the search space for ICR is two dimensional and implementation becomes much more challenging.
Rather than searching the 2-D plane using brute force or some generic optimization strategy, there exists an iterative method that converges on ICR within 3 or 4 iterations. Brandt’s method is fast and efficient, and it is what AISC uses to construct their design tables. You can read the paper here. It’s incredibly short and concise, or as the author puts it in the concluding remark:
“In any problem to be solved by iteration, one can hope for 1.) A good place to start and 2.) An efficient algorithm for improving each successive trial. The procedure presented appears to offer both of these characteristics”
The two key insights presented by Brandt’s method is summarized below:
Insight #1: Elastic method also has a center of rotation and can be readily calculated
Let \((x_{cg}, y_{cg})\) be the coordinate of bolt group centroid, the coordinate for the elastic center of rotation (ECR) is \((x_{cg} +a_x, y_{cg}+a_y)\):
\[a_x = -\frac{P_y}{n} \frac{J}{M_z}\] \[a_y = \frac{P_x}{n} \frac{J}{M_z}\]Where:
- \(P_x\) = x component of applied load
- \(P_y\)= y component of applied load
- \(n\) = number of bolts in bolt group
- \(J\) = polar moment of inertia (\(I_z\))
- \(M_z\) = applied torsion
Insight #2: Elastic center of rotation (ECR) can be used as the initial guess of (ICR), subsequent improvements can be achieved as follows:
Let the initial guess be the ECR:
\[x_0 = x_{cg} +a_x\] \[y_0 = y_{cg} + a_y\]At this assumed ICR location, calculate force equilibrium. Note the moment equilibrium will be enforced when we determine \(R_{max}\) at each step (this will become evident when we go through the step-by-step procedures)
\[\sum F_x = f_{xx} = P_x - \sum R_{x}\] \[\sum F_y = f_{yy} = P_y - \sum R_{y}\]The force summations will not be zero unless we are at the ICR, use the residual to determine successive guesses:
\[x_{i+1} = x_i - \frac{f_{yy}J}{nM_z}\] \[y_{i+1} = y_i + \frac{f_{xx}J}{nM_z}\]Repeat until the desired tolerance is achieved:
\[\mbox{residual} = \sqrt{(f_{xx})^2 + (f_{yy})^2} < tol\]ICR Method Procedure
-
Determine bolt group geometric properties
\[x_{cg} = \frac{\sum x_i}{N_{bolts}}\] \[y_{cg} = \frac{\sum y_i}{N_{bolts}}\] \[I_x = \sum (y_i - y_{cg})^2\] \[I_y = \sum (x_i - x_{cg})^2\] \[I_z = J = I_p = I_x + I_y\] -
From applied force \((P_x, P_y, M_z)\), calculate load vector orientation (\(\theta\)). Note atan2 is a specialized arctan function that returns within the range between -180 to 180 degrees, rather than -90 to 90 degrees. This is to obtain a correct and unambiguous value for the angle theta.
\[P = \sqrt{P_x^2 + P_y^2}\] \[\theta = atan2(\frac{P_y}{P_x})\] -
Now calculate eccentricity and its x and y components. We can use \(e_x\) and \(e_y\) to locate the point of applied load (let’s call this point P). We know the line P-ICR is perpendicular to the load vector orientation, hence \(\theta+90^o\). Note that figures within ICR tables in AISC steel manual is misleading. It seems to imply no vertical eccentricity (\(e_y = 0\)), yet such an assumption would make the load vector non-orthogonal to the ICR.
\[e = \frac{M_z}{P}\] \[e_x = - e \times cos(\theta + 90^o)\] \[e_y = - e \times sin(\theta + 90^o)\] -
Obtain an initial guess of ICR location per Brandt’s method, then calculate distance of line P-ICR (\(r_o\))
\[a_x = V_y \times \frac{I_z}{M_z N_{bolt}}\] \[a_y = V_x \times \frac{I_z}{M_z N_{bolt}}\] \[x_{ICR} = x_{cg} - a_x\] \[y_{ICR} = y_{cg} + a_y\] \[r_{ox} = e_x + a_x\] \[r_{oy} = e_y - a_y\] \[r_{o} = \sqrt{r_{ox}^2 + r_{oy}^2}\] -
Compute ICR coefficient “C” at assumed location.
\[C = \frac{ \sum((1 - e^{-10 \Delta_i})^{0.55} d_i)}{r_o}\] -
Next, we need to determine the maximum bolt force (\(R_{max}\)) at the user-specified load magnitude. This can be done through the moment equilibrium equation; hence why we only need to check force equilibrium at the end. Moment equilibrium is established as a matter of course by enforcing a specific value of \(R_{max}\)
\[M_p = V_x r_{oy} - V_y r_{ox}\] \[M_r = R_{max} \times \sum((1 - e^{-10 \Delta_i})^{0.55} d_i)\] \[R_{max} = \frac{M_p}{\sum((1 - e^{-10 \Delta_i})^{0.55} d_i)}\] -
Now that we have \(R_{max}\), we can calculate the other bolt forces:
\[R_i = R_{max} \times \sum((1 - e^{-10 \Delta_i})^{0.55} d_i)\] -
Now calculate the bolt forces’ x and y component to check force equilibrium:
\[cos(\theta) = d_x / d = sin(\theta+90^o)\] \[sin(\theta) = d_y / d = -cos(\theta+90^o)\] \[R_x = R_i cos(\theta+90^o) = -R_i \frac{d_y}{d}\] \[R_y = R_i sin(\theta+90^o) = R_i \frac{d_x}{d}\] -
Calculate residual and repeat until a specific tolerance is achieved.
\[\sum F_x = f_{xx} = P_x - \sum R_{x}\] \[\sum F_y = f_{yy} = P_y - \sum R_{y}\] \[\mbox{residual} = \sqrt{(f_{xx})^2 + (f_{yy})^2} < tol\] -
If equilibrium is not achieved, go back to step 4 with the following modifications
\[a_x = f_{yy} \times \frac{I_z}{M_z N_{bolt}}\] \[a_y = f_{xx} \times \frac{I_z}{M_z N_{bolt}}\] \[x_{ICR,i} = x_{ICR,i-1} - a_x\] \[y_{ICR,i} = x_{ICR,i-1} + a_y\] -
Once ICR has been located, calculate connection capacity:
\[P_{capacity} = C \times R_{capacity}\] \[DCR = \frac{P}{P_{capacity}} = \frac{R_{max}}{R_{capacity}}\]
Comparison Study
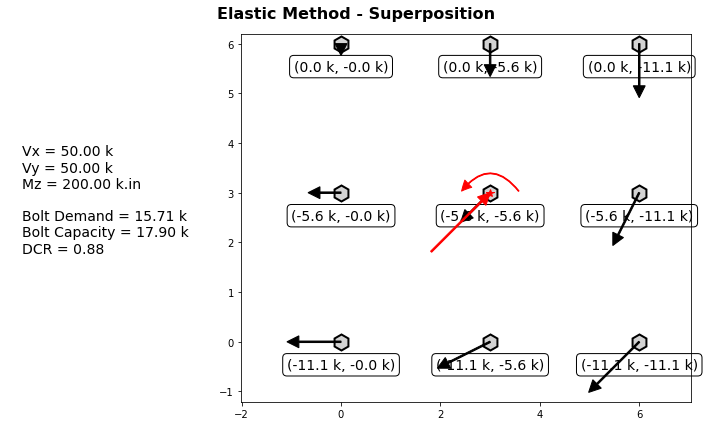
Suppose we have the following bolted connection with (9) 3/4” A325-N bolts arranged in a 3x3 square pattern. We apply 50 kips vertically, 50 kips horizontally, and apply 200 kip.in of torsion. The bolt capacity for one 3/4” A325-N bolts is 17.9 kips.
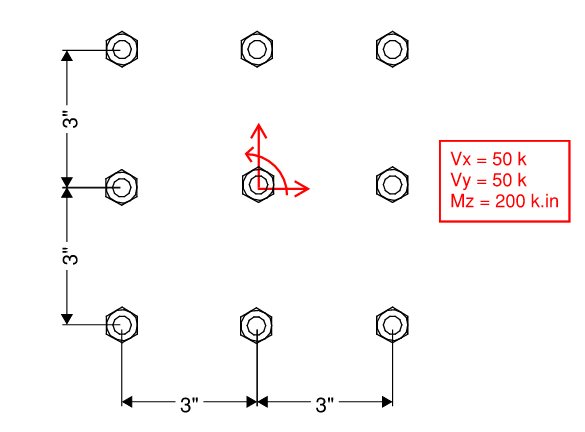
Using elastic method, we get the following:
Using ICR method, we get the following:
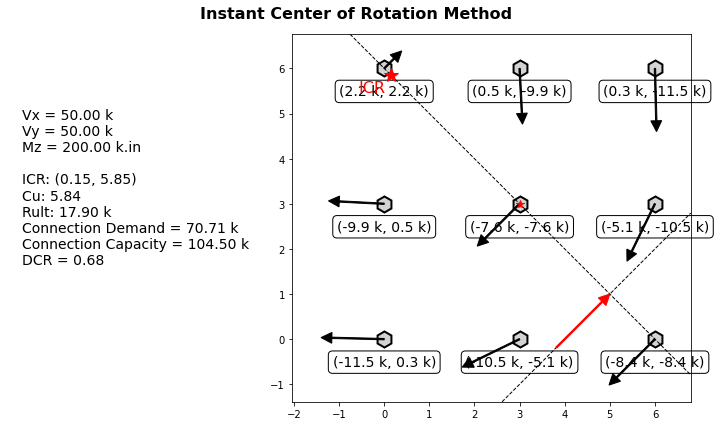
In summary, the DCRs:
- Elastic Method:
- Max Bolt Force = 15.71 kips
- Bolt Capacity = 17.9 kips
- DCR = 88%
- ICR Method:
- C = 5.84
- Connection Capacity = 17.9 * 5.84 = 104.5 kips
- Connection Demand = 70.71 kips
- DCR = 67%
3.0 Demands - Welded Connections
3.1 General Information
Two important notes about weld before we proceed.
-
Whether a weld is subjected to tension or shear is irrelevant, all weld fail in shear along the throat length. The throat thickness of a fillet weld is illustrated in the figure below.
 Figure 3.12: Weld Throat Thickness
 -
Unlike mechanical engineers who prefer to work with stress (ksi), weld demand in structural engineering is typically expressed as force per linear length (kip/in). In other words, how much force can be resisted per linear inch of weld. By working with demand with one length dimension less, we get the added benefit of being able to calculate demand without knowing the weld throat thickness (a design parameter that we typically specify later). To convert one to the other, simply divide by the throat.
3.2 Elastic Method
Calculating weld stress is essentially analogous to calculating cross-section elastic stress. There is an excellent figure from the “Design of Welded Structures” textbook by Omer W. Blodgett that illustrates this concept superbly.
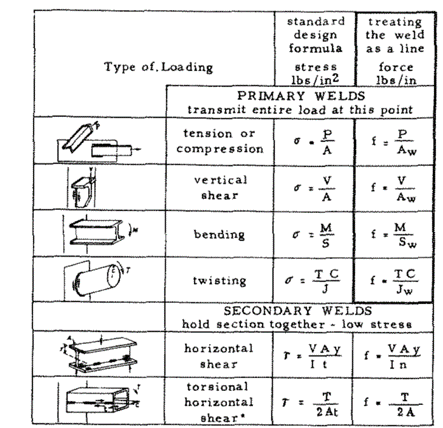 Figure 3.11: Demand on Weld Groups Analogous to Sections
Weld Group Geometric Properties
The geometric properties of various weld groups are shown in the figure below.
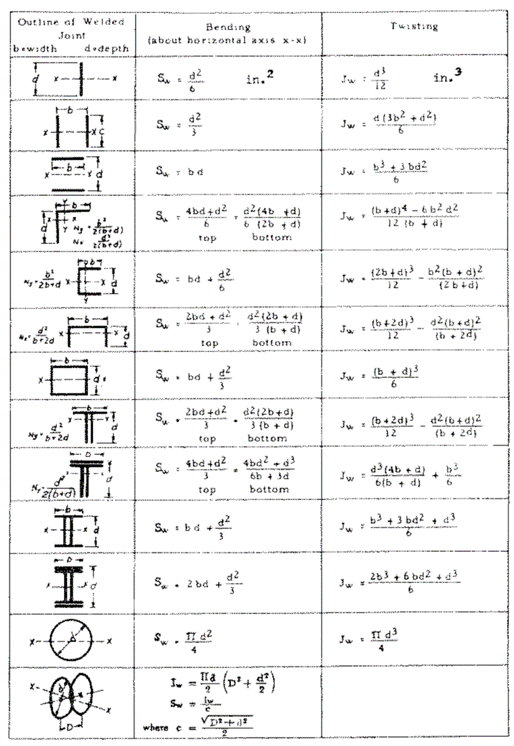 Figure 3.13: Weld Group Geometric Properties
- You may also calculate these properties manually using moment of inertia equations for composite shapes. Width of weld is assumed to be unity (hence why the unit is slightly different).
- For example, a single vertical line of weld => \(I = bd^3/12 = (1)d^3/12 = d^3/12\), then the section modulus is equal => \(S = I/c = \frac{d^3/12}{d/2} = d^2/6\) which matches the table above.
Elastic Method for Weld Group Example
Once we have the geometric properties, we can apply the formulas in figure 3.11 and use principle of superposition to calculate a final weld demand (kip/in). An example is shown below.
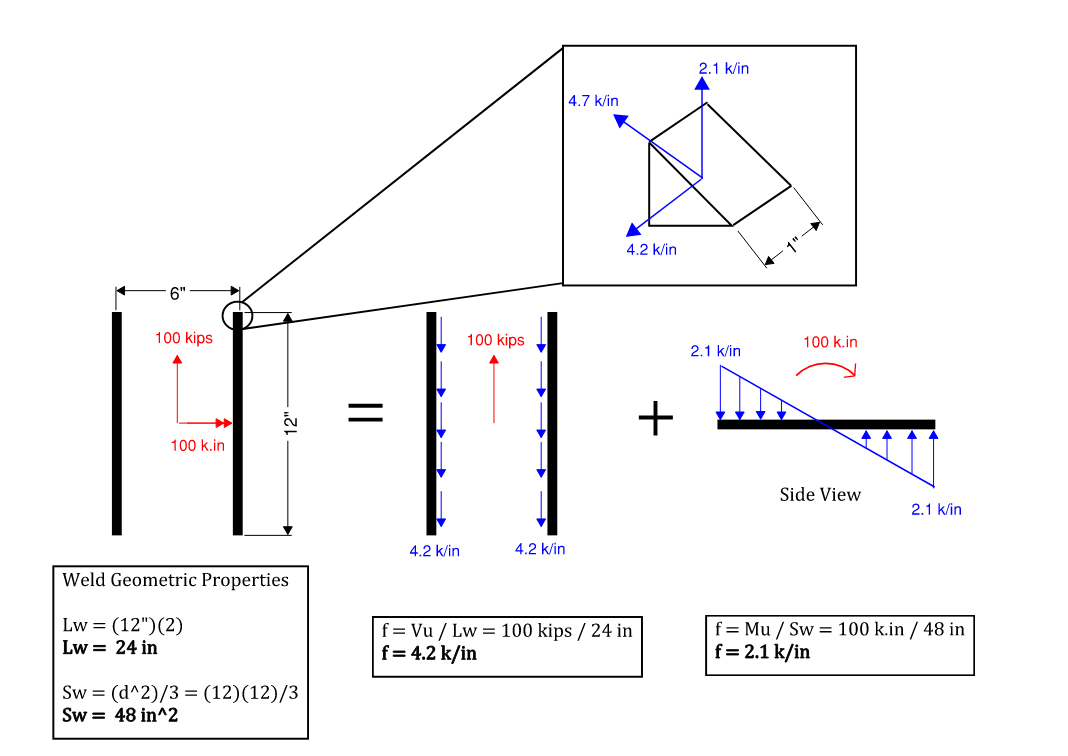 Figure 3.14: Weld Group Elastic Method Example
If we have a 5/16” fillet weld with capacity of 31.5 ksi or 6.96 kip/in.
Looking at it as a structural engineer (force per unit length):
\[DCR = \frac{4.7 k/in}{6.96 k/in} = 0.675\]Looking at it as a mechanical engineering (stress). 5/16” fillet weld has a throat thickness of 0.22”
\[(4.7 kip/in) / (0.22 in) = 21.27 ksi\] \[DCR = \frac{21.27 ksi}{31.5 ksi} = 0.675\]The instant center of rotation method is available for welds as well, though much less commonly used. Refer to Blodgett’s excellent textbook on welding for more info. ICR method for weld will not be discussed here.
4.0 Capacity - Base Material
4.1 Material Properties
The most commonly specified material properties for various structural shapes are shown below. Refer to Table 2-4 to 2-6 of the steel construction manual for more info.
Steel Sections:
- ASTM A36 (plates, bars, angles, channels)
- \(F_y\) = 36 ksi
- \(F_u\) = 58 ksi
- ASTM A572 Gr. 50 (plates)
- \(F_y\) = 50 ksi
- \(F_u\) = 65 ksi
- ASTM A992 (W-sections)
- \(F_y\) = 50 ksi
- \(F_u\) = 65 ksi
- ASTM A913 Gr. 65 (W-sections)
- \(F_y\) = 65 ksi
- \(F_u\) = 80 ksi
- ASTM A500 Gr. C (HSS rectangular)
- \(F_y\) = 50 ksi
- \(F_u\) = 62 ksi
- ASTM A500 Gr. C (HSS round)
- \(F_y\) = 46 ksi
- \(F_u\) = 62 ksi
4.2 Shear Yielding and Rupture
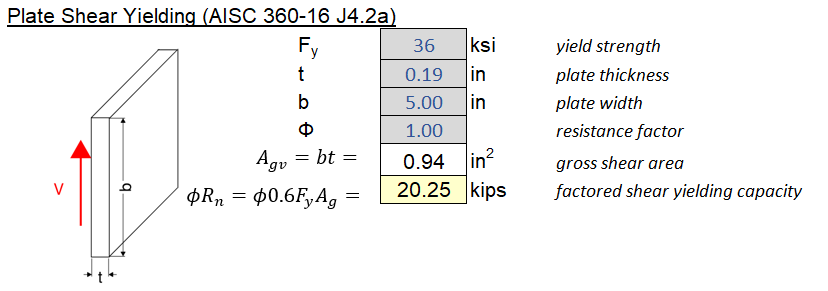
Shear Yielding (\(\phi = 1.0\)):
\[\phi R_n = \phi 0.6 F_y A_{gv}\]Shear Rupture (\(\phi=0.75\)):
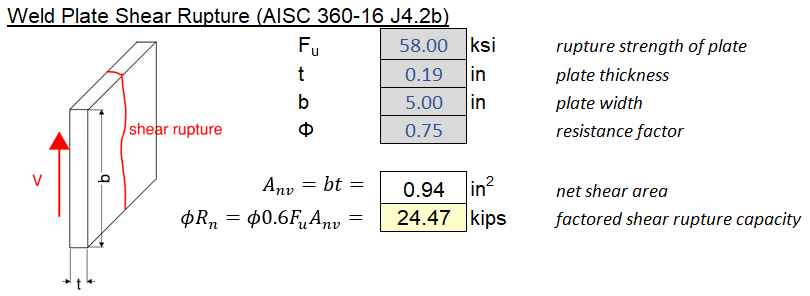
\[\phi R_n = \phi 0.6 F_u A_{nv}\]Additional Remarks:
- Yielding is always checked with the gross shear area without considering bolt hole reductions. While yielding at the net section will occur first, the deformation is fairly localized and does not impact member performance until rupture. On the other hand, if the entire gross area yields, it’s likely that the deformation has spread throughout the member
- Rupture is always check with the net shear area. For welded sections without holes. Net shear area is equal to gross shear shear. Refer to section 5.6 for how shear rupture is calculated with bolt-holes.
- The subscript “v” is meant to denote shear. For example, for wide-flange sections, Agv only includes the area of the web.
Example Calculation:
4.3 Tension Yielding and Rupture
Tension Yielding (\(\phi = 0.90\)):
\[\phi R_n = \phi F_y A_{g}\]Tension Rupture (\(\phi=0.75\)):
\[\phi R_n = \phi F_u A_{e}\]Additional Remarks:
- Refer section 4.2 for note about gross area and net area.
- To clarify on the notations:
- \(A_g\) = gross area
- \(A_n = A_g - A_{holes} - A_{tolerance}\) = net area. For welded sections, net area and gross area are the same. Refer to Section 5.6 for net area for bolted sections.
- \(A_e = U A_e\) = effective area. Due to shear lag effects, the net area may not be fully available. Refer to the table below for how the shear lag factor U is calculated.
- For design of gusset plates, the gross area is not obvious and need to be reduced as well. The standard practice is use use the Whitmore Section which is shown below.
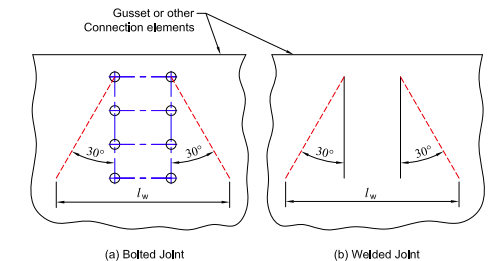 Figure 4.31: Whitmore Section for Tension and Compression of Gusset Plates
What is shear lag? To explain it conceptually, imagine water being released into an empty small channel which suddenly transitions to a larger channel. Does the water flow perpendicularly to fill the entire width immediately?
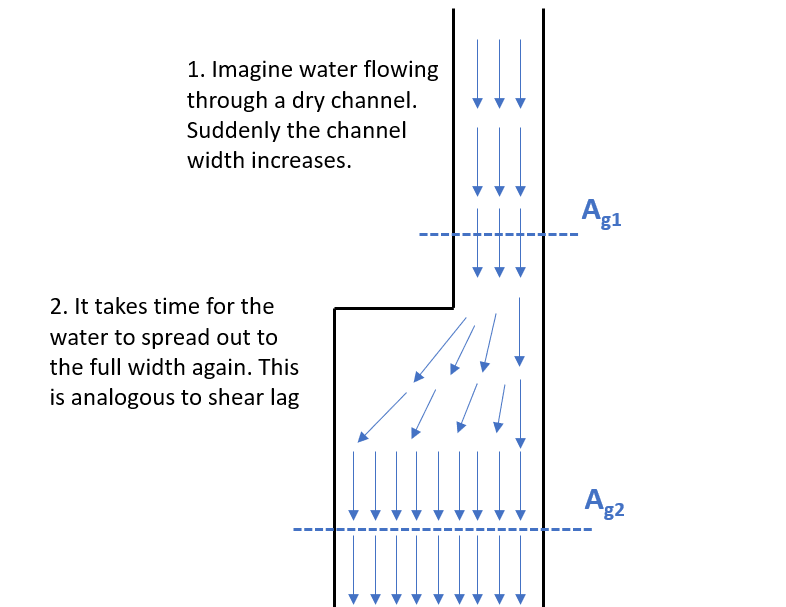 Figure 4.32: Shear Lag Analogy
Similarly for forces “flowing” through a member, it takes time for all the area to be fully utilized. One can say that there is a “lag” between where the force is transferred, and where the full section area can be utilized. For example, if a wide-flange member is spliced only at the web, we can only fully engage flange area some distance away and not immediately. This phenomenon is sometimes referred to as St. Venant Principle.
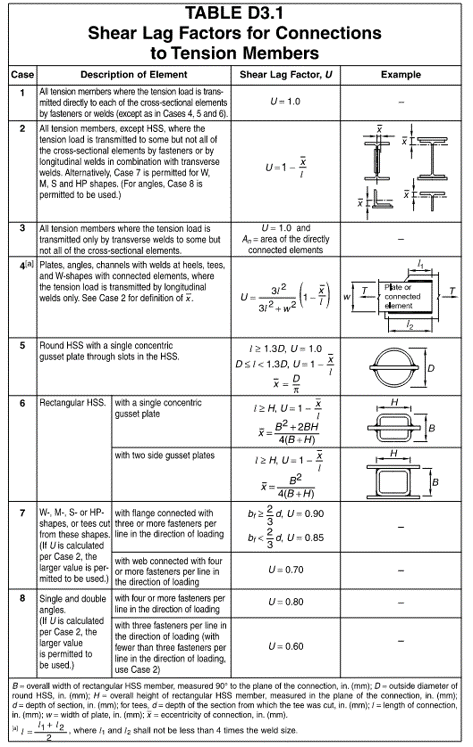 Table 4.31: Shear Lag Factor for Tension Members
Example Calculations:


4.4 Block Shear of Welded Connections
Block shear is essentially a combination of tension and shear yielding/rupture failure, whereby a “block” of the base material is sheared off. We will first look at block shear of welded section. Refer to section 5.7 for block shear of bolted connections.
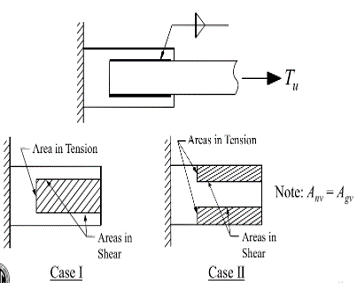 Figure 4.41: Block Shear is Possible for Welded Sections
In the figure above, notice how there is generally two cases of block shear to consider for welded tension connections.
Welded Block Shear (\(\phi=0.75\)):
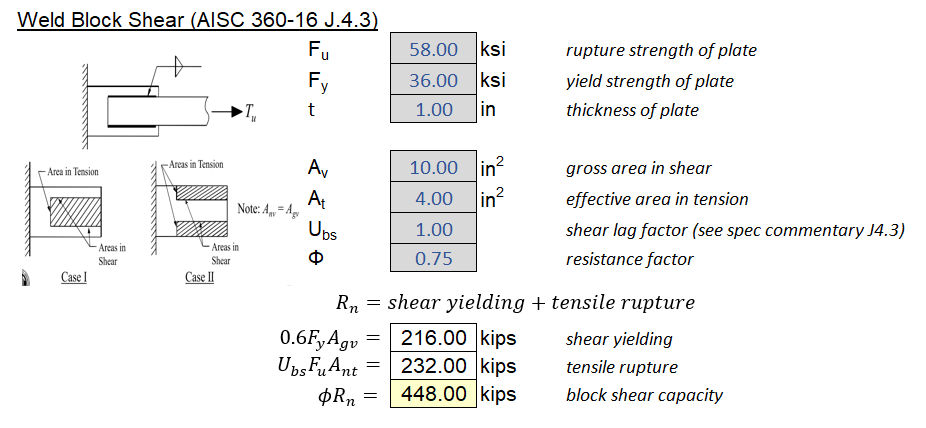
\[R_n = 0.6F_uA_{nv} + U_{bs}F_uA_{nt} \leq 0.6F_yA_{gv} + U_{bs}F_uA_{nt}\]Since \(A_{gv} = A_{nv}\) for welded sections, we know that the ceiling value governs because Fy is less than Fu. Therefore, block shear capacity for welded section is equal to shear yielding + tension rupture.
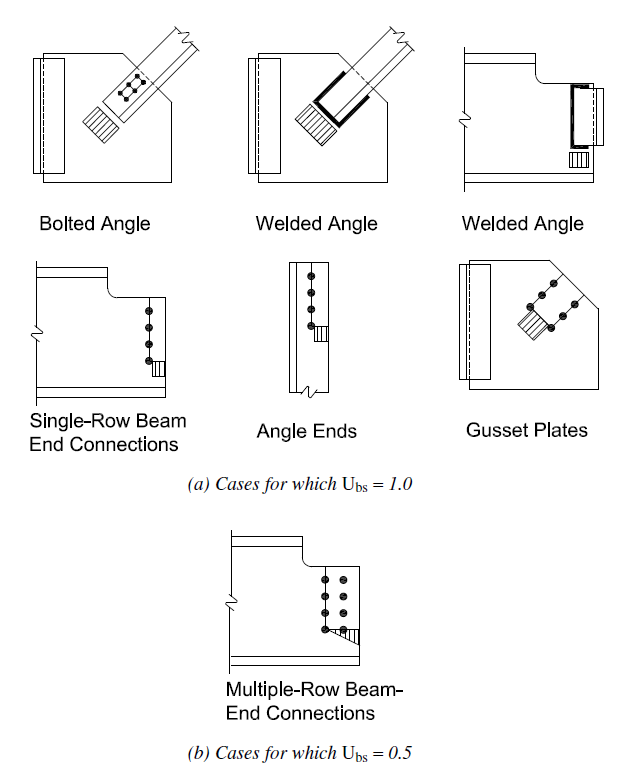
\[\phi R_n = \phi (0.6F_yA_{gv} + U_{bs}F_uA_{nt})\]\(U_{bs}\) is a shear lag factor for block shear that is usually equal to 1.0. Refer to the figure below for when it is equal to 0.5.
Example Calculation:
4.5 Flexure
Generally speaking, flexure at a local level can be calculated with AISC 360-16 F.11. Moment Capacity of Rectangular Bars (\(\phi = 0.9\)). Note the shape factor of a rectangular section is 1.5, therefore the ceiling value will never govern.
\[\phi M_n = \phi F_y Z \leq 1.6F_yS_x\]In order for the above equation to be applicable, we must preclude any stability-related limit states (which is a given for minor-axis bending). The limiting unbraced length for major-axis bending is:
\[L_b \leq \frac{0.08E t^2}{F_y d}\]Additional Remarks:
- As the span gets longer, the local member is treated like a beam and we need to consider lateral-torsional buckling per Chapter F.11.2 of AISC 360-16.
- For coped beams connections, there are special provisions to bending that is fair bit more complex. Refer to the Steel Construction Manual Section 8.
Example Calculation:

4.6 Compression
Compression in connections can be divided into 3 categories:
Bearing Capacity. \(A_{pb}\) is the projected area in bearing. See special case equations for rockers and rollers in AISC 360-16 J7.b (\(\phi = 0.75\)).
\[\phi R_n = \phi 1.8 F_y A_{pb}\]Non-slender Element Compression Capacity (\(\phi = 0.90\)):
\[\phi R_n = \phi F_y A_{g}\]For the above equation to apply, the slenderness ratio must be below 25:
\[\frac{KL}{r} \leq 25\]If a slenderness ratio of 25 is exceeded, we must use the typical column equations per AISC 360-16 chapter E (\(\phi = 0.90\)):
\[\phi R_n = \phi F_{cr} A_g\] \[F_e = \frac{\pi E}{(KL/r)^2}\] \[F_{cr} = \left\{ \begin{array}\\ F_y (0.685^{F_y/F_e}) & \mbox{if } F_y/F_e \leq 2.25\\ 0.877F_e & \mbox{if } F_y/F_e > 2.25 \end{array} \right.\]Additional Remarks:
- Many questions arise regarding non-slender compression design of connections. What to do when KL/r > 25? The biggest question seems to be what effective length factor (k) to use. In short, since we are mostly concerned with local effects, k = 1.0 will suffice for most situations. Member and system level stability should be evaluated separately considering stiffness of connections. The figure below from AISC 360-16 Commentary on Appendix 7 should be helpful.
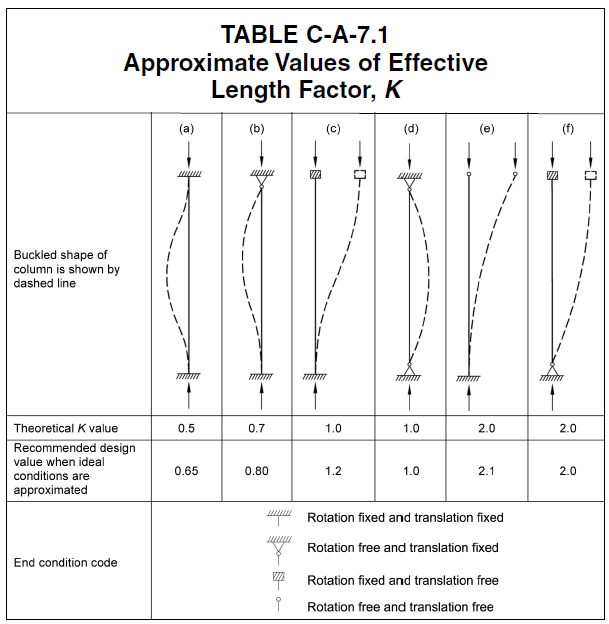 Figure 4.61: Recommended K-Factor from AISC
- Compression check of gusset plate is a fairly common in connection design check and is well-researched. According to Dowswell (2006), the recommended K-factors and unbraced lengths for gusset plates are summarized below:
 Figure 4.62: Recommended K-Factor for Gusset Plates
Example Calculation:
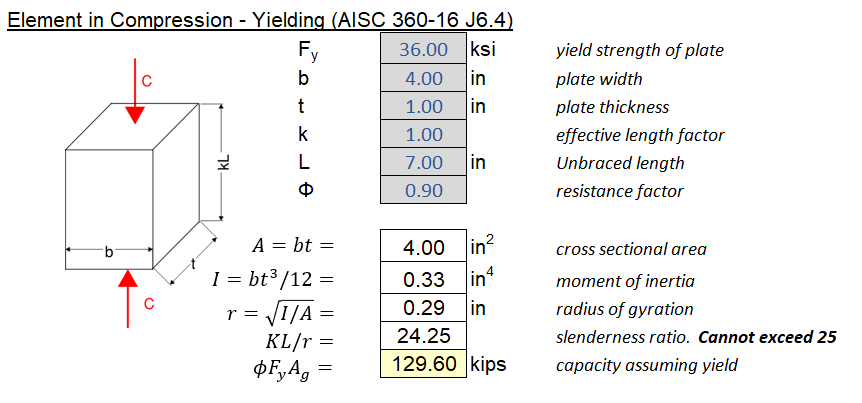
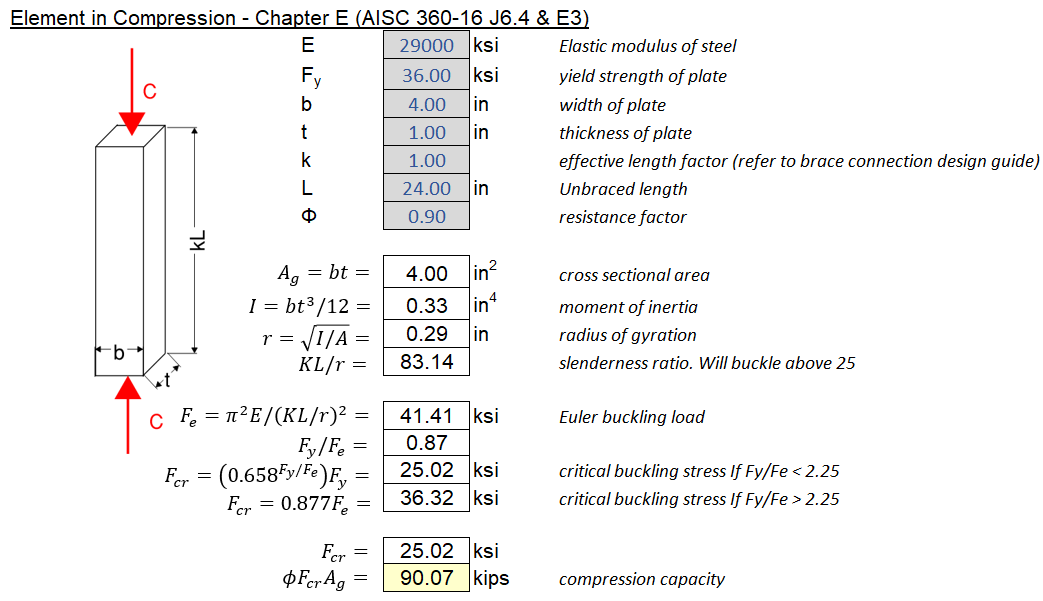

4.7 Local Concentrated Load - Flange Bending
Section 4.7 to 4.12 are all related to concentrated forces. The first limit state we will look at is flange bending.
Local Flange Bending Capacity (\(\phi = 0.90\)):
\[\phi R_n = \phi 6.25 F_y t_f^2 C_t\] \[C_t = \left\{ \begin{array}\\ 1.0 & \mbox{if force is at interior location}\\ 0.5 & \mbox{if force is less than 10tf away from end support} \end{array} \right.\]Additional Remarks:
- This limit state is only checked for tension (i.e forces applied away from the web) because the primary failure mode is weld fracture at the web. It can be argued that this limit state doesn’t apply to rolled-shapes. Nevertheless, it’s often checked and usually doesn’t govern.
- A more typical check for both tension AND compression is to assume a 2.5:1 yield line radiating from point load to the web, then calculating the plastic moment capacity of a certain width of flange. Alternatively, the AISC commentary recommends effective width of 12tf (radiating 6tf in each direction).
- If the beam is already highly stressed, the flange will be in significant bi-axial stress in which case we should check Von-Mises stress.
- Web stiffeners are typically provided which essentially preclude this failure mode.
Example Calculation:

4.8 Local Concentrated Load - Web Local Yielding
Unlike the previous failure mode, this one applies to both tension and compression and may govern especially for thin webs.
Local Web Yielding Capacity (\(\phi = 1.0\)):
\[\phi R_n = \phi F_y t_w L_{web}\]The length of web engaged in compression/tension is determined assuming a 2.5:1 spread through the flange. “k” is the distance from tip of flange to start of k-region and “lb” is the length of bearing. This is illustrated graphically below.
\[L_{web} = \left\{ \begin{array}\\ 5k + l_b & \mbox{if force at interior location}\\ 2.5k + l_b & \mbox{if force is less than "d" away from end support} \end{array} \right.\]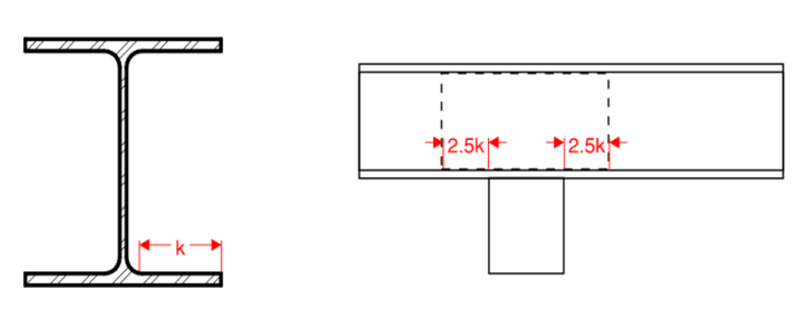 Figure 4.81: Illustration of Effective Web Width
Additional Remarks:
- Stiffeners or doubler plates may be provided to increase the gross area in bearing or tension
Example Calculation:

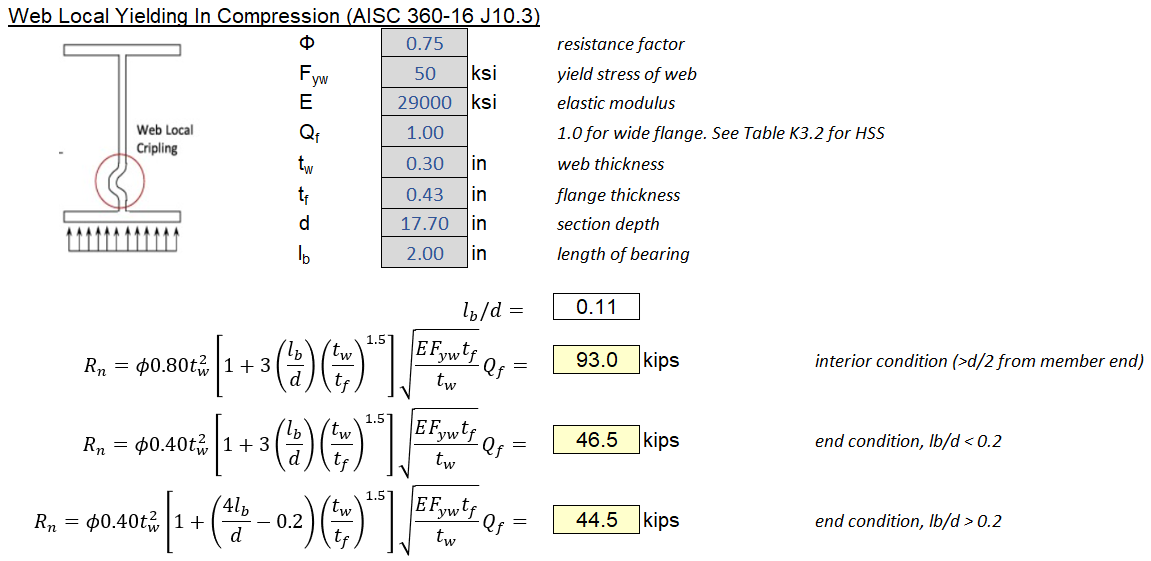
4.9 Local Concentrated Load - Web Local Crippling
Before 1986, local web yielding an crippling are considered the same. Afterwards, a distinction is made. Web local crippling is more of a local crumpling and is more common for thin webs, whereas local web yielding is more common for stockier webs.
Local Web Yielding Capacity (\(\phi = 0.75\)):
First equation is applicable for interior conditions:
\[R_{n1} = 0.80t_w^2 (1 + 3(\frac{l_b}{d}) (\frac{t_w}{t_f})^{1.5}) \sqrt{\frac{E F_y t_f}{t_w}} Q_f\]Second equation is for end conditions with force less than d/2 away from support and \(l_b/d \leq 0.2\):
\[R_{n2} = 0.40t_w^2 (1 + 3(\frac{l_b}{d}) (\frac{t_w}{t_f})^{1.5}) \sqrt{\frac{E F_y t_f}{t_w}} Q_f\]Third equation is for end conditions with force less than d/2 away from support and \(l_b/d > 0.2\):
\[R_{n3} = 0.40t_w^2 (1 + (\frac{4 l_b}{d}-0.2) (\frac{t_w}{t_f})^{1.5}) \sqrt{\frac{E F_y t_f}{t_w}} Q_f\]Additional Remarks:
- \(l_b\) is the length of bearing, \(Q_f\) is equal to 1.0 for wide-flange members. Refer to AISC 360-16 for HSS members.
- Note this limit state only applies for compression on one flange only. Refer to section 4.11 for compression on both flanges.
- Stiffeners may be added to stabilize the web
Example Calculation:
4.10 Local Concentrated Load - Web Sidesway Buckling
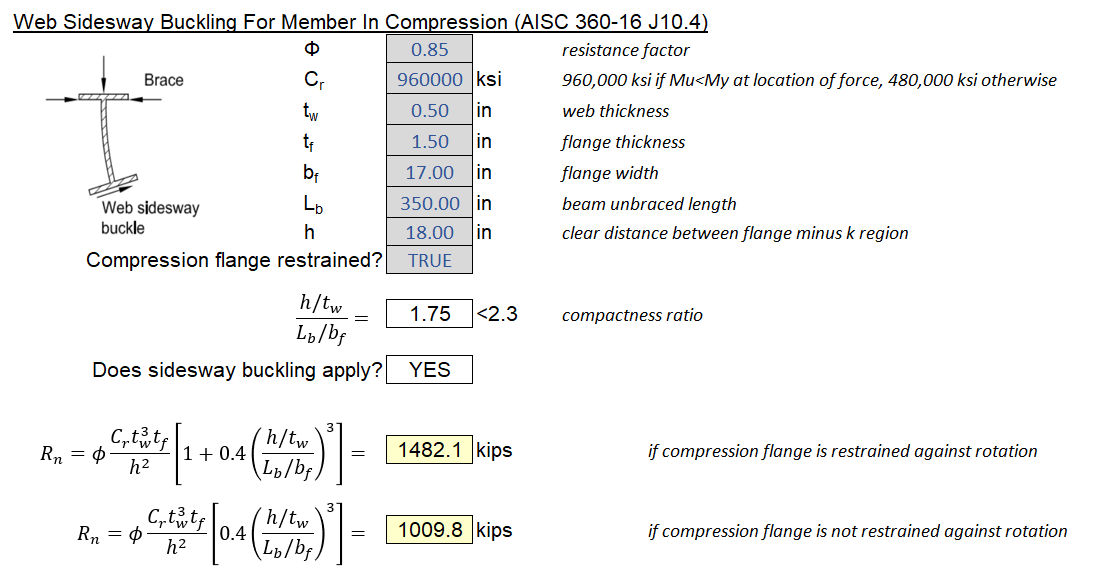
Web Sidesway Buckling is a stability-related limit state. In essence, a very localized load can cause compressive stress and sideways buckling of the web, overcoming the stabilizing effect of the tension flange. What is more peculiar is that buckling can occur even with the top flange fully braced. This limit state as more of a member-level check, I like to think of it like an extended LTB check for point loads.
Web Sidesway Buckling (\(\phi = 0.85\)):
When the compression flange is restrained against rotation and \((h/t_w)/(L_b/b_f) \leq 2.3\):
\[\phi R_n = \phi \frac{C_rt_w^3t_f}{h^2} \left[ 1 + 0.4(\frac{h/t_w}{L_b/b_f})^3 \right]\]When the compression flange is free to rotate and \((h/t_w)/(L_b/b_f) \leq 1.7\):
\[\phi R_n = \phi \frac{C_rt_w^3t_f}{h^2} \left[ 0.4(\frac{h/t_w}{L_b/b_f})^3 \right]\]For all other cases where the \((h/t_w)/(L_b/b_f)\) ratio is too high, web sidesway buckling need not be checked.
- \(L_b\) is the largest unbraced length along either flange. Refer to the figure below for an illustration
- \(h\) is the clear distance between flange minus the k-regions
- \(C_r\) is a factor dependent on moment demand with respect to elastic moment capacity
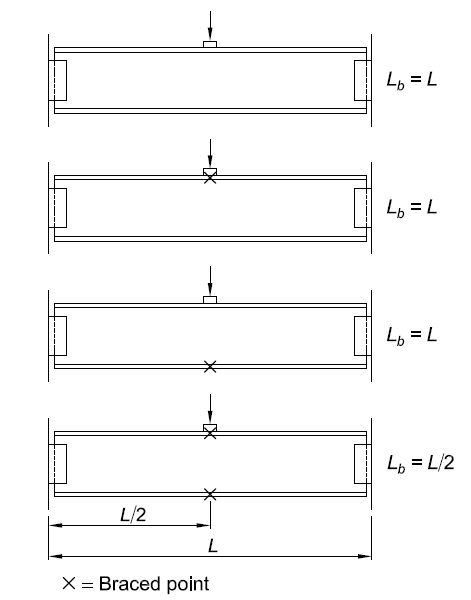 Figure 4.101: Unbraced Length for Various Bracing Arrangements
Additional Remarks:
- I’ve never seen this limit state govern (at least for common rolled shapes used in building structures. Pay particular attention to this when you have a extraordinary large concentrated load or deep plate girder.
Example Calculation:
4.11 Local Concentrated Load - Web Buckling
Unlike section 4.9 or 4.10, this section applies to cases where compressive load is applied to both flanges. The web essentially acts as a plate column compressed on both sides.
Web Compression Buckling With Load at Both Flanges (\(\phi = 0.90\))
\[\phi R_n = \phi (\frac{24t_w^3\sqrt{EF_y}}{h})Q_f C_t\]- \(Q_f\) is equal to 1.0 for wide flange sections. Refer to AISC 360-16 Table K3.2 for HSS conditions
- \(C_t\) is equal to 1.0 for interior conditions, and 0.5 for end conditions when force is less than d/2 away from support.
The equation above applies for when \(L_b/d \leq 1.0\) (roughly a square panel. \(L_b\) is length of bearing). If the ratio is higher, design the web like a column per AISC 360-16 chapter E. See below for an appropriate assumption of column dimensions.
Additional Remarks:
- Stiffeners may be added to stabilize the web, the resulting cruciform section is designed as a column with the following parameters (h is clear distance between flange minus k-region)
Example Calculation:

4.12 Local Concentrated Load - Concrete Bearing
This limit state is identical to the one specified in ACI 318-19. I am actually not sure why AISC is providing design recommendations for concrete. Typically, concrete bearing failure occurs at around 0.85f’c. If the support area is must larger than the load area, the surrounding concrete provides a confinement effect which results in up to double the bearing capacity.
Bearing Capacity of Concrete (\(\phi = 0.65\))
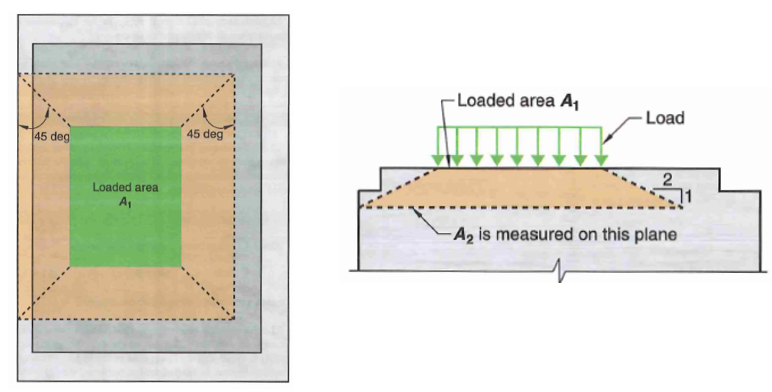
\[\phi R_n = \phi \alpha 0.85 f_c^{'} A_1 \leq 1.7f_c^{'}A_1\] \[\alpha = \sqrt{A_2/A_1}\]- \(\alpha\) is a confinement factor that is equal to 2.0 if the concrete support is well-confined by surrounding concrete. If the bearing area not confined (e.g. base plate on a pedestal of same size), then alpha is taken as 1.0
- \(A_1\) is the loaded area
- \(A_2\) is the projected area based on a 2H:1V line as shown in the figure below.
Example Calculation:

5.0 Capacity - Bolted Connections
5.1 General Information
Bolted connections are preferred over welded in almost all cases. They require less inspection, less labor, and are easier to build.
Common Bolt Materials
- ASTM A307:
- \(F_u\) = 60 ksi
- Group A - ASTM F3125 GR.A325:
- \(F_u\) = 120 ksi
- Group B - ASTM F3125 GR.A490:
- \(F_u\) = 150 ksi
Types of Bolted Connections
- Snug-tight
- Most economical solution. Specify wherever possible.
- Suitable for most statically loaded connections.
- Pretensioned
- Applicable when a connection requires pretension but its slip resistance is not a concern.
- Minimum pretension is typically around 70% of specified ultimate tensile strength
- Slip-critical
- Required for most connections that undergo cyclic loading.
- Connection performance is entirely dependent on slip resistance (i.e. friction between two faying surfaces).
Refer to RCSC specifications for guidance on when to use snug-tight, pretension, and slip-critical connections. Some general rules:
- use snug-tight connection wherever possible
- use slip-critical connection for any cyclic loading and connection with oversized holes
- use pretensioned for A490 bolts subjected to tension demand, column splice in very slender buildings, and connections with cyclic loading where slip capacity is not critical.
Bolt Spacing
AISC 360-16 Chapter J3 calls for a minimum spacing of 2.66d, although 3.0d is preferable. As a rule of thumb, use a minimum spacing of 3 inches which is enough for bolts less than 1-1/8” (try not to specify bolts greater than 1-1/8” as they are difficult to install)
There is also a max spacing provision intended to prevent moisture intrusion and corrosion which is equal to the min(6”, 12t). Note the maximum spacing provision does not apply to two shapes in continuous contact.
Bolt Hole Dimensions
Bolt hole can be categorized into 5 groups:
- Standard (STD)
- Oversized (OVS)
- Short Slot
- Long Slot
- Extra OVS (for base plates)
Standard (STD) Hole dimensions follow the following pattern.
- Bolt Diameter < 1 in:
- Bolt Diameter \(\geq\) 1 in:
Hole dimensions for other configurations are shown below. For design purposes, an additional 1/16” is added for any limit state involving hole area to account for imperfection during drilling/punching.
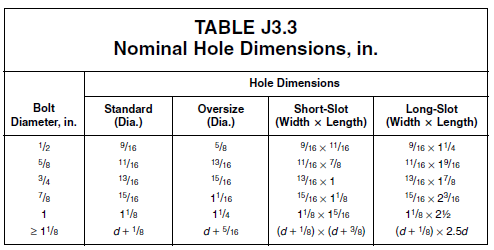 Figure 5.11 Hole Dimension for Bolts
Bolt Edge Distance
A 3” edge distance can be specified for simplicity. When you have no other option but to to place bolt closer to the edge, refer to the table below. Note the tabulated limit are meant for fabrication and installation only. Edge tear-out capacity may warrant larger edge distance.
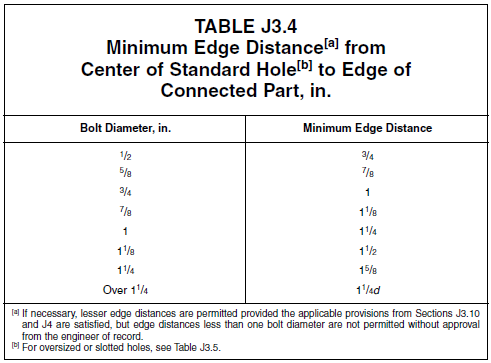 Figure 5.12 Minimum Edge Distance
For oversized holes, add \(c_2\) to the value in the table above.
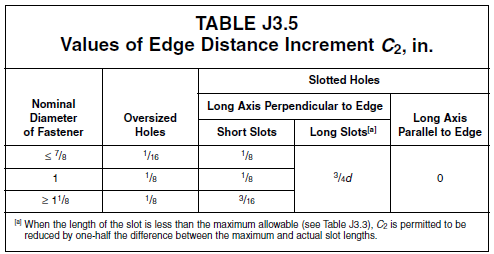 Figure 5.13 Minimum Edge Distance Increment for OVS holes
Combining Bolts with Welds
Designing connections with both welds and bolts is not recommended due to their different force-deformation response. Transverse welds tend to be much stiffer than bolts and will dominate response.
- For bolts with longitudinally loaded welds
- For bolts with transverse loaded welds, ignore bolt capacity entirely
5.2 Bolt Tensile and Shear Rupture
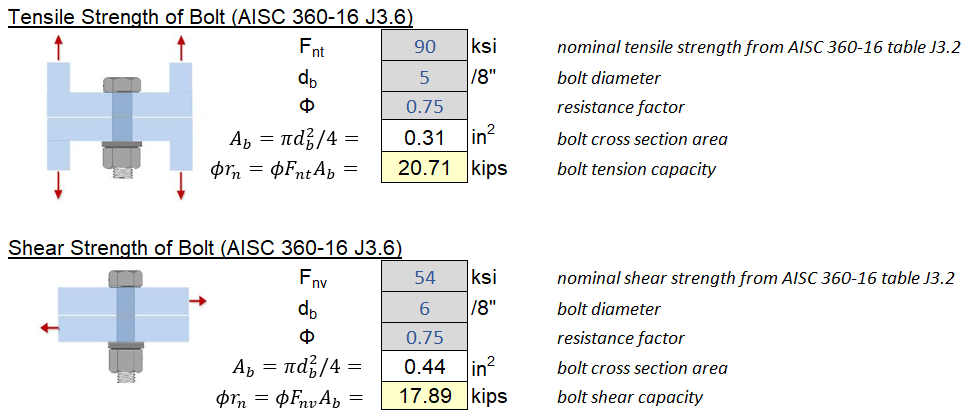
Bolt Tensile Rupture (\(\phi = 0.75\)):
\[\phi R_n = \phi F_{nt} A_{b}\]Bolt Shear Rupture (\(\phi = 0.75\)):
\[\phi R_n = \phi F_{nv} A_{gv}\]- \(F_{nt}\) - effective strength in tension (see table below)
- \(F_{nv}\) - effective bolt strength in shear (see table below)
- \(A_b\) - bolt gross area
AISC takes an unique approach to calculating bolt capacities. Due to the presence of threads, it is obvious bolt area would need to be reduced accordingly. Rather than reducing area, AISC opted to use an effective stress (\(F_{nt}, F_{nv}\)) instead and just use the gross bolt area
\[F_{nt} = 0.75F_u\] \[F_{nv} = \left\{ \begin{array}\\ 0.563F_u & \mbox{threads excluded from shear plane -X}\\ 0.45F_u & \mbox{threads included from shear plane -N} \end{array} \right.\]The table below provides effective stresses for various bolt grade.
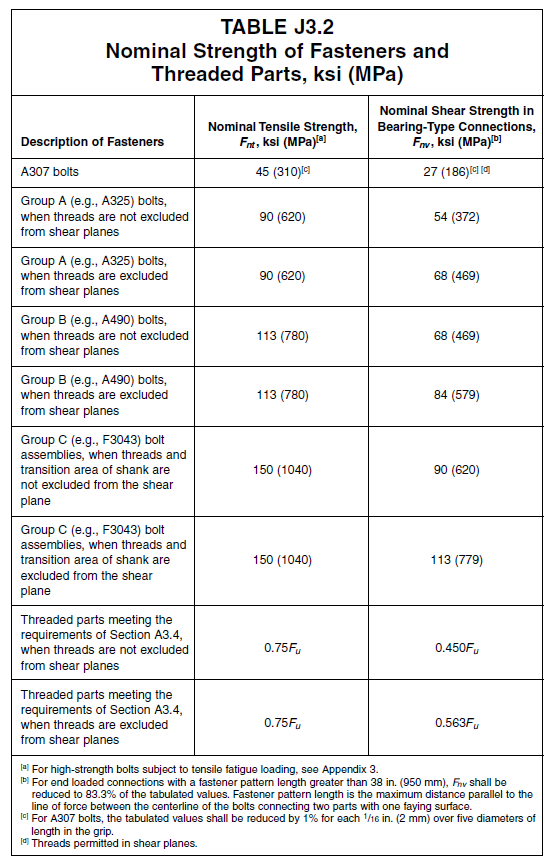 Figure 5.21: Effective Stress of Fasteners
Additional Remarks:
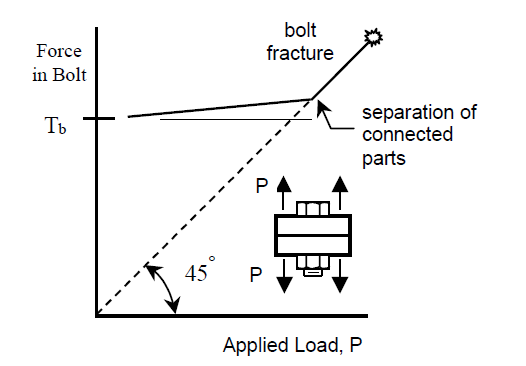
- Whether a bolt has pretension or not DOES NOT affect its tensile capacity. A bolt with 30 kips tension capacity pretensioned to 20 kips will still be able to resist 30 kips! Applied tension and bolt pretension is not additive! This has been confirmed experimentally as well. Why?
- The unloading stiffness of the compressed plate is much higher than loading stiffness of the bolts
- In other words, the two connecting plates decompresses before any additional tension is exerted onto the bolts themselves.
- Shear and tension force-deformation curve is entirely nonlinear, hence why we use ultimate strength (Fu) rather than yield strength (Fy)
- If you would like to calculate the net area for some reason, the equation below can be used. \(d\) is bolt diameter and \(n_t\) is thread count per inch.
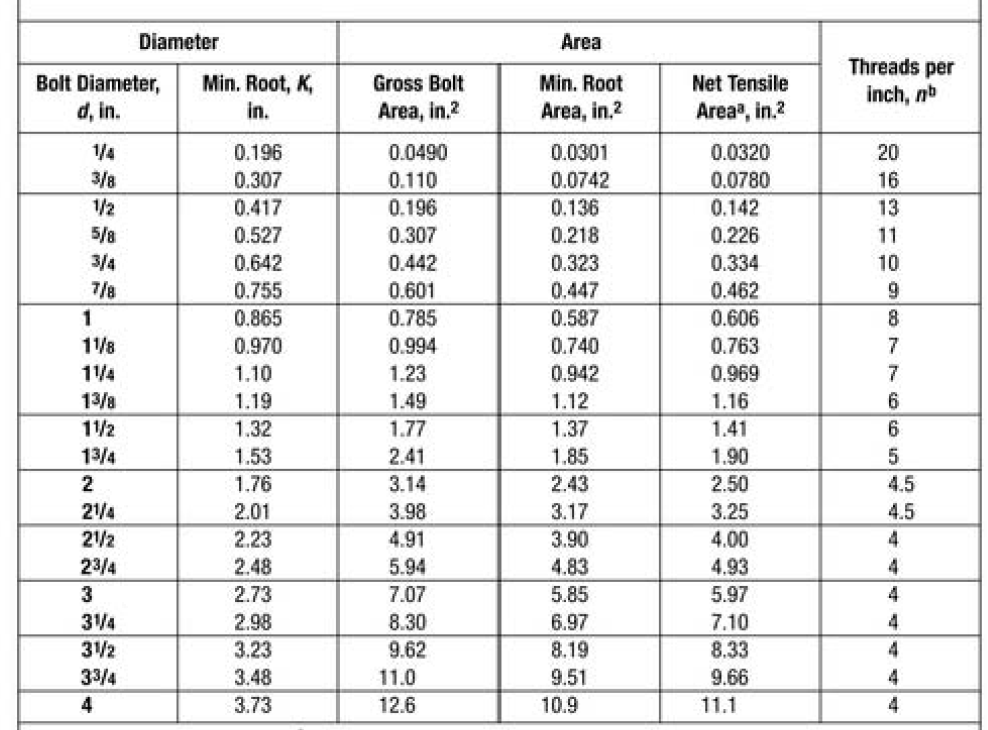 Figure 5.22: Thread Per Inch For Various Bolt Diameters
- As I’ve mentioned previously, applied force isn’t actually distributed evenly through out a bolted connection. For very long splices, drawing out the free body diagram would reveal that the end bolts are resisting much higher strain. For splices longer than 38 inches, use \(0.83F_{nv}\)
Example Calculation:
5.3 Combined Shear and Tension Interaction
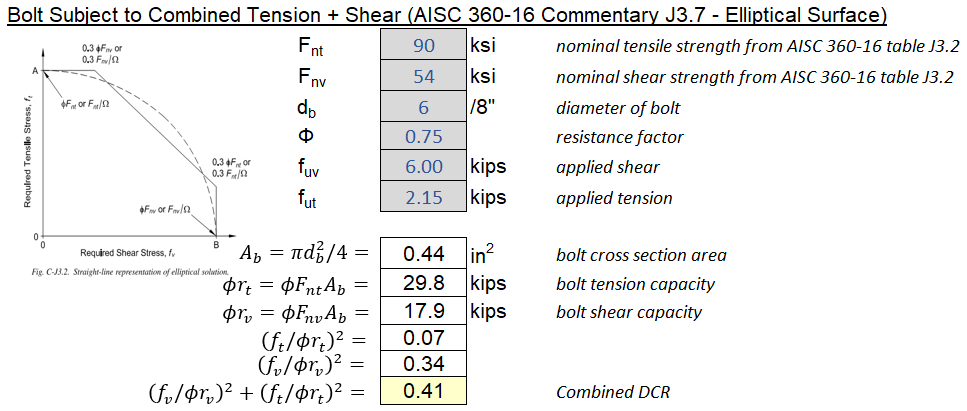
When a bolt is subjected to both tension and shear, a simple elliptical interaction equation can be used and is allowed by AISC 360-16 J.37 commentary.
\[(\frac{t_u}{\phi t_n})^2 + (\frac{v_u}{\phi v_n})^2 \leq 1.0\]Alternatively, AISC 360 presents a piecewise equation that is less commonly used where you calculate a “tension capacity in presence of shear” or vice versa. The one piece of information that is valuable from those equations is that combination of shear and tension demand need not be considered if either is less than 30% of the capacity.
Example Calculation:
5.4 Slip Critical Bolts
The bolt capacities presented in 5.2 are bearing-type. The equations below are meant for slip-critical connections where shear capacity is equal to slip capacity.
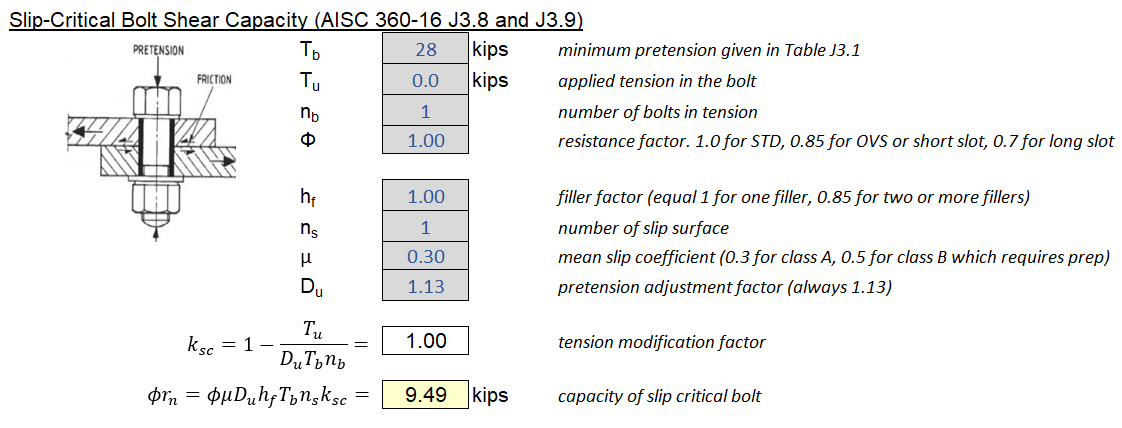
Slip critical bolt shear capacity:
\[\phi R_n = \phi \mu k_{sc} D_u h_f T_b n_s\]where:
- \(\phi = 1.0\) for STD holes or short slot holes perpendicular to slotted end.
- \(\phi = 0.85\) for short slot holes where load is towards slotted end
- \(\phi = 0.70\) for long slot holes
- \(D_u = 1.13\) which is a ratio of mean actual pretension to min specified pretension
- \(T_b\) = minimum bolt pretension (See Table J3.1 below)
- \(n_s\) = number of slip planes
- \(h_f\) = filler factor. Equals 1.0 for one filler plate, equals 0.85 for two or more.
- \(\mu\) = friction coefficient. Equals 0.30 for class A surface, 0.5 for class B surface. Class B requires more prep work and is more expensive.
- \(k_{sc}\) is a reduction factor for applied tension
Where:
- \(T_u\) is the applied tension
- \(n_b\) is the number of bolts carrying tension
Refer to the table below for appropriate pretension to use:
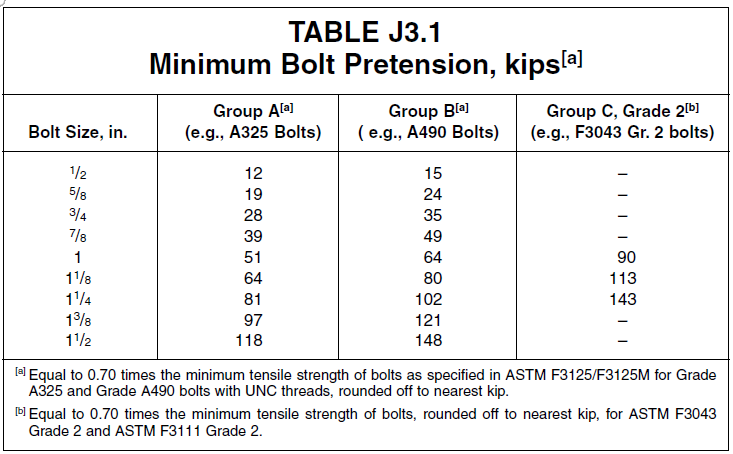 Figure 5.41: Minimum Bolt Pretension
Example Calculation:
5.5 Bolt Bearing and Tear Out
For relatively thin plate, or bolts close to the edge, there are material-related failure modes that must be checked. Namely bolt bearing and tear out:
Bolt Bearing (\(\phi = 0.75\)):
\[\phi R_n = \phi 2.4F_u d t\]Bolt Tear Out (\(\phi = 0.75\)):
\[\phi R_n = \phi 1.2F_u l_c t\]For long-slotted holes with force perpendicular to slots, change the above coefficients to 2.0 and 1.0, respectively.
Where:
- \(d\) is the bolt nominal diameter
- \(t\) is the plate thickness
- \(l_c\) is the clear distance between edges of tear out.
Additional Remarks:
- These two limit states have to be check for slip-critical bolts as well. This ensures the connections still has reserve capacity beyond slip.
Example Calculation:

5.6 Shear and Tensile Rupture (Bolted Connections)
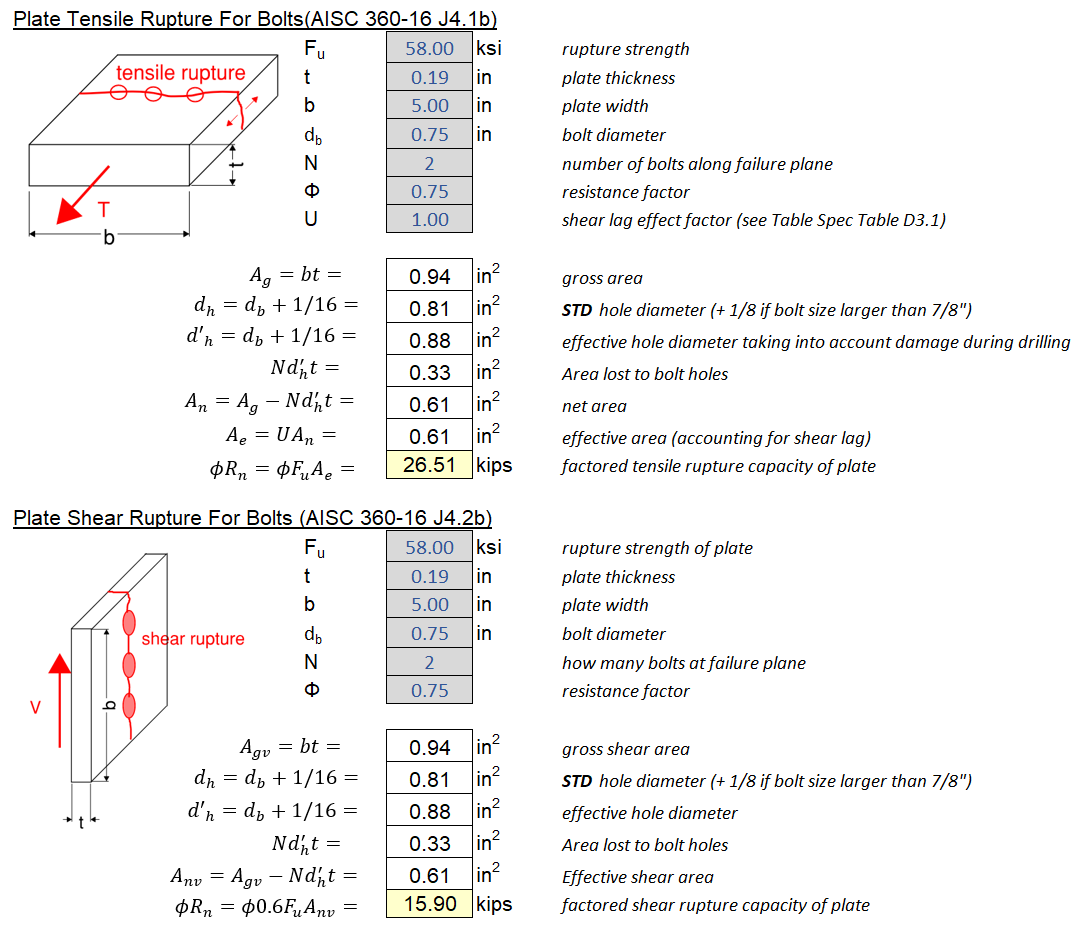
This section explains how the presence of holes influence a material’s shear and tensile rupture capacity. Refer to Section 4.3 for the shear and tensile rupture equations.
Area lost to bolt holes is equal to:
\[N_{bolt} d_h' t\]Where \(N_{bolt}\) is the number of bolt holes crossing failure plane, \(d_h'\) is the effective hole diameter, and \(t\) is the plate thickness.
Area definition:
- \(A_g = bt\) = gross area
- \(A_{net} = A_g - A_{holes}\) = net area accounts for holes
- \(A_{effective} = A_{net} \times U\) = effective area accounts for shear lag
Diameter definition:
- \(d_b\) = diameter of bolt
- \(d_h\) = diameter of holes (usually 1/16 to 3/16 larger than \(d_b\))
- \(d_h' = d_h + 1/16\) = effective diameter of holes (adds 1/16” allowance for damage during drilling)
Example Calculation:
5.7 Block Shear (Bolted Connections)
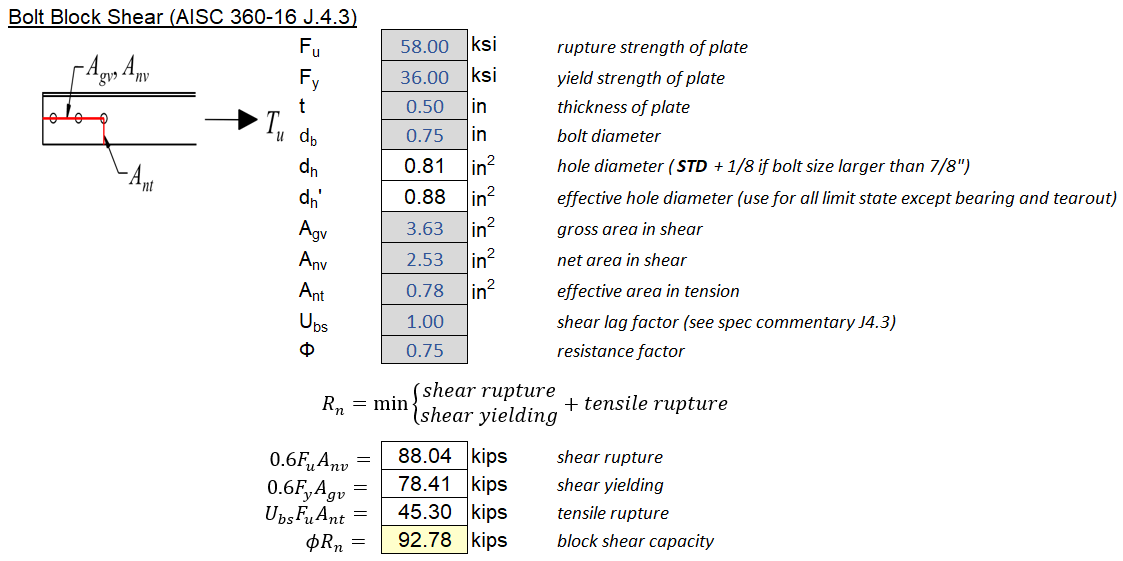
Block shear is essentially a combination of tension and shear yielding/rupture failure, whereby a “block” of the base material is sheared off. For a bolted-connection, there could be numerous possible failure paths, all of them must be evaluated.
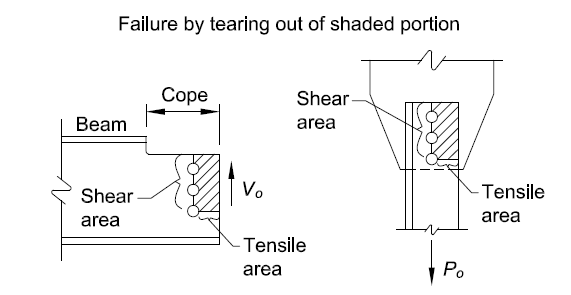 Figure 5.71: Block Shear Failure Mode
Welded Block Shear (\(\phi=0.75\)):
\[R_n = 0.6F_uA_{nv} + U_{bs}F_uA_{nt} \leq 0.6F_yA_{gv} + U_{bs}F_uA_{nt}\]The equation above can be interpreted as follows:
\[R_n = min(\mbox{shear rupture},\mbox{shear yielding}) + \mbox{tensile rupture}\]\(U_{bs}\) is a shear lag factor for block shear that is usually equal to 1.0. Refer to the figure below for when it is equal to 0.5.

Example Calculation:
6.0 Capacity - Welded Connections
6.1 General Information
The design and detailing of welded connections is an extremely nuanced subject that cannot possibly be covered here in any comprehensive way.
In this section, we will only cover the basics of welded connections: welding terminologies, welding processes, weld metal capacity, and various tips and tricks for engineers. For those interested, there is a 334 page pdf document published by AISC that is a gold mine. Link to Design Guide 21.
What is Welding?
Welding involves the fusion of two base metal usually through mixing of filler metals. Two conditions are required for welding to occur.
- Atomic closeness - metallic atoms are brought to close contact usually achieved through heat and pressure
- Atomic cleanness - surface must be non-oxidized, yet metal surfaces will only oxide-free for short period of time when in contact with air. Shielding is often provided through slag (as a mechanical lid) or inert gases.
Types of Welding Process
Here are the different types of welding processes commonly seen in building construction. The selection of appropriate welding process is up to the contractors. Nevertheless, It’s still good for the engineer of record to be conversant in the different welding processes and metallurgical properties. Such knowledge may come in handy during the shop-drawing review process when reviewing Welding Procedure Specifications (WPS) for pre-qualified welding procedures.
- SMAW - Shielded Metal Arc Welding, also known as stick welding. A stick (electrode) is melted down by electricity and leaves a protective slag coating.
- Sticks are about 24” long, so the welding needs to start and stop repeatedly
- Great for tack welds and small repairs due to its flexibility.
- Simplest weld, but not very productive due to constantly having to swap electrodes
- FCAW has mostly displaced SMAW in building construction
- FCAW - Flux Cored Arc Welding is the most commonly used and economical welding solution.
- It is less portable with bulkier equipment. Electrodes come in spools so the welder can essentially weld forever unlike SMAW
- Gas-shielded (FCAW-G). Must be sheltered with wind not exceeding 10 mph.
- Self-shielded (FCAW-S). Less shelter requirements but gas-shielded is generally preferred
- SAW - Submerged Arc Welding is mostly used in fabrication shops. Weld is submerged by a granular sand-like material.
- Automated. No smoke. No flash.
- Good for long uninterrupted weld and parts that can be easily positioned in shop.
- The weld also looks clean which is great for Architecturally Exposed Structural Steel (AESS)
- GMAW - Gas Metal Arc Welding is also known as MIG (metal inert gas) welding. Not commonly used in structural applications. More common for sheet metal.
- Very similar to FCAW but uses a wire rather than flux-cored tubular wire
- One important note for structural engineer is that there are various modes of transfer for MIG welding and short-circuit mode of transfer is NOT allowed due to fusion problems
- ESW/EGW - Electroslag Welding is incredibly niche, sometimes used for tall-building box columns
- GTAW - Gas Tungsten Arc Welding is often used for aluminum and stainless steel. Not usually used if other option exists
- Arc Stud Welding for welding shear studs for composite beam and or other concrete-to-steel connections.
Weld Terminology
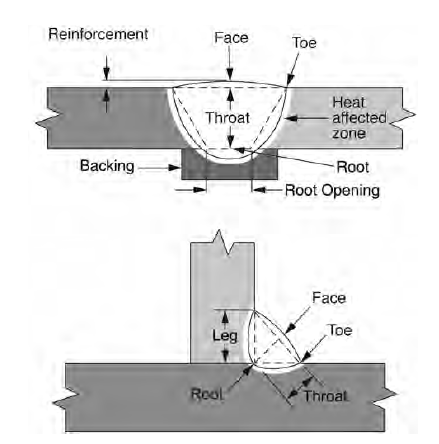 Figure 6.11: Welding Terminologies
Types of Welded Connection Joint
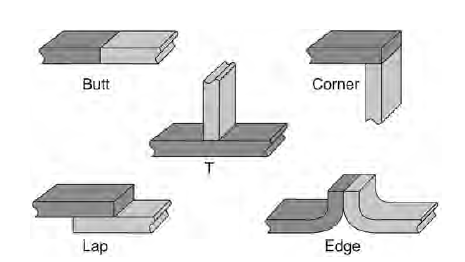 Figure 6.12: Types of Welded Joints
Types of Weld
- Fillet Weld
-
First choice most common welding type. Engineers should specify the leg dimension “L” on drawings, effective throat length is then calculated to be “0.707L”. If the adjoining plate are at an angle other than 45 degrees, then:
\[E = Lcos(\theta)\]
-
- PJP - Partial Joint Penetration
- Used when CJP is overkill. Also used for joining faces of HSS.
- Different from fillet welds, engineers should specify effective throat dimension (“E”) rather than leg dimension (“L”). This is because “E” is dependent on many factors including welding process. It is up to the contractors to specify welding procedures that can achieve “E”
- CJP - Complete Joint Penetration
- Easy but often abused. Develops material strength, therefore no design calculation is required.
- Plug or Slot
- Often used as repair where weld filler metal is deposited into bolt holes
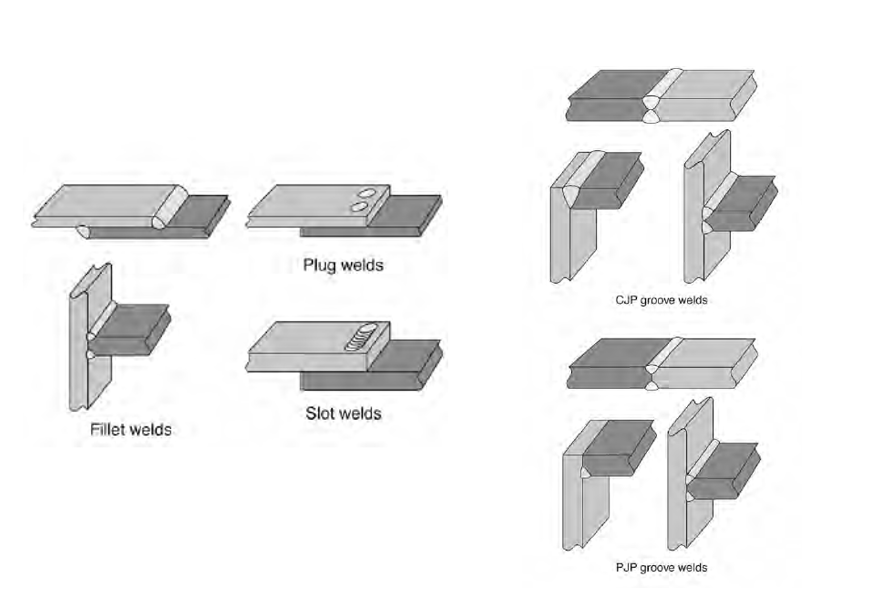 Figure 6.13: Types of Welds
Reading Weld Call Outs
Weld call out can get quite complicated, but don’t get overwhelmed. The most commonly used symbol are:
- Fillet, CJP, or PJP symbol
- Weld size
- Indication of weld on arrow side or other side
- “T” to add any additional remarks you have
- Length and pitch of weld for intermittent fillets
- Field weld symbol
- Weld all around symbol
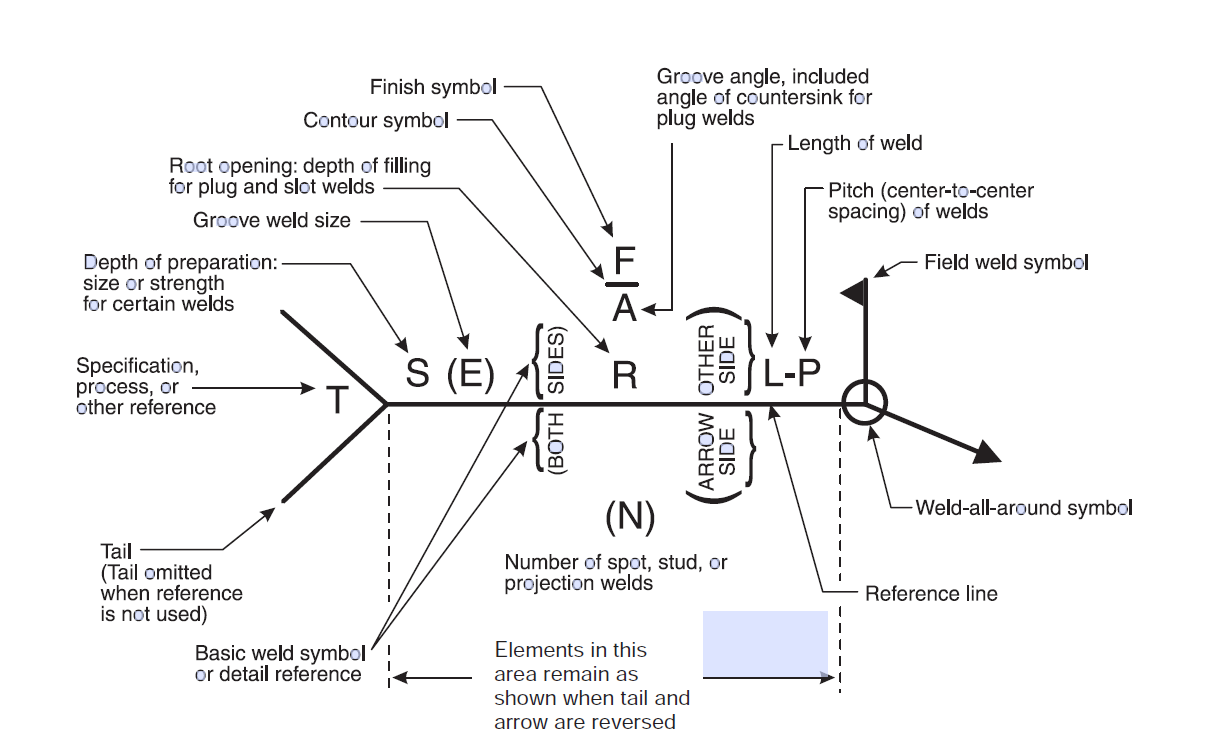 Figure 6.14: Weld Call Out Format
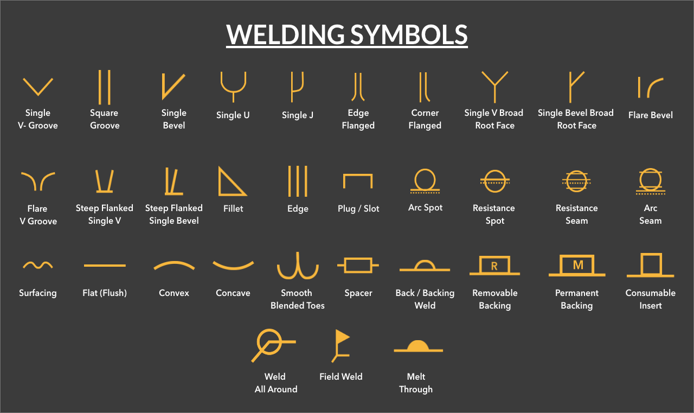 Figure 6.15: Welding Symbols
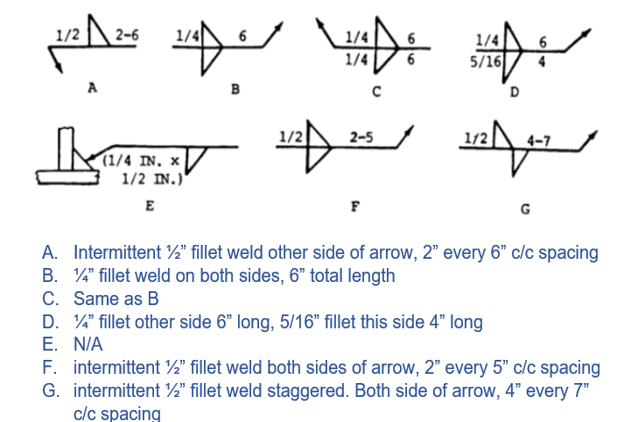 Figure 6.16: Weld Call Out Examples
Welded Connection Design Tips
There are simply far too many nuances to discuss when it comes to welded connections. Here are some points to keep in mind:
- Try to provide the most direct load path possible without introducing any eccentricities and shear lag effects
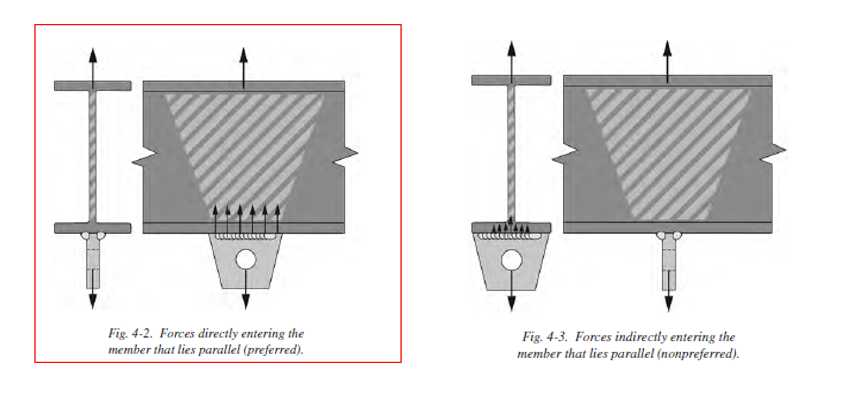
- Be careful of stress-risers especially for non-static loading applications
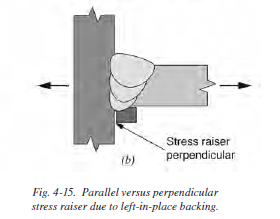
- Welded connections are not efficient in resisting moment, avoid if possible
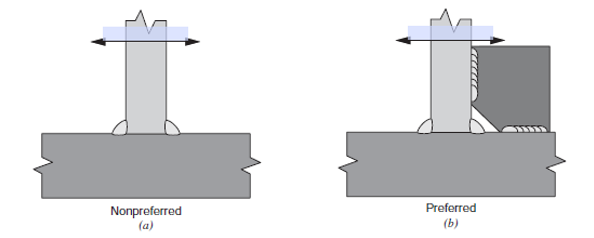
- Never allow rotation about root of weld
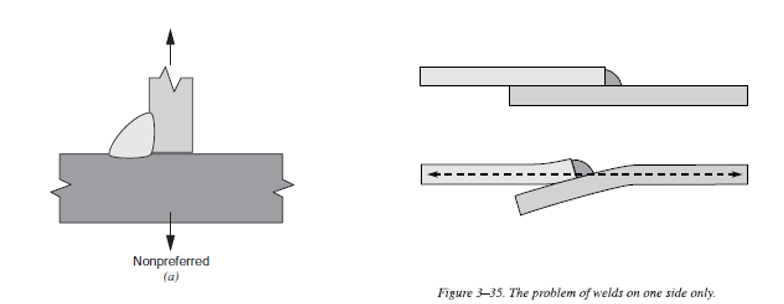
- Avoid melting away the edges
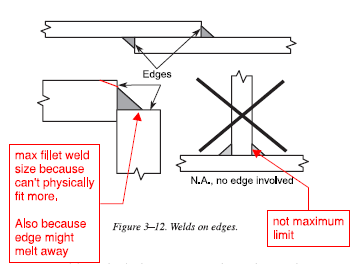
Other Topics
- Weld dimensional requirements are provided by AISC and AWS for constructability and fabrication reasons. They must be respected in addition to strength requirements.
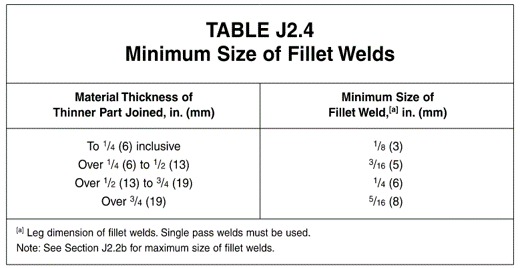
- Min fillet weld size is provided to avoid welds that are too small (see table below)
- Max fillet weld size is provided to avoid cutting away edge of plate. Fillet weld should at most be \(tp - 1/16"\)
- Min fillet weld length is provided to avoid welds that are too small. Length must be at least \(L_{min} = 4t_{leg}\)
-
Max fillet weld length is provided to recognize that stress is not distributed uniformly along a very long weld. Maximum weld length is: \(L_{max} = 100 t_{leg}\) (around 30 inches for 5/16” weld), beyond this length, a shear lag factor must be applied:
\[\beta = 1.2 - 0.002(\frac{L}{t_{leg}}) \leq 1.0\]
- When welding to web of wide-flange sections, avoid the K-area which has residual stresses and is generally poor for welding. Note k-area DOES NOT include the radius itself; instead it’s 1.5 inch beyond the radius.

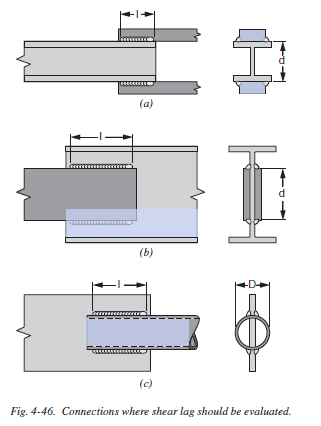
- Be cognizant of shear lag where tensile and shear stress are non-uniform at connections and only becomes uniform further down the member. You usually have to reduce area and account for this stress increase. AISC provides shear lag factor (U) to account for these effects.
- For weld metals not in continuous contact (i.e. with gaps), effective throat dimension must be reduced appropriately. AWS D1.1 requires fillet weld size be increased by the amount of the gap if gap is greater than 1/16”

- Overmatching occurs when the filler metal is stronger than the base metal; Undermatching occurs when fillet metal is weaker. Undermatching is typically not practical because most welds are +70 ksi, and most structural steel are around 50 ksi.
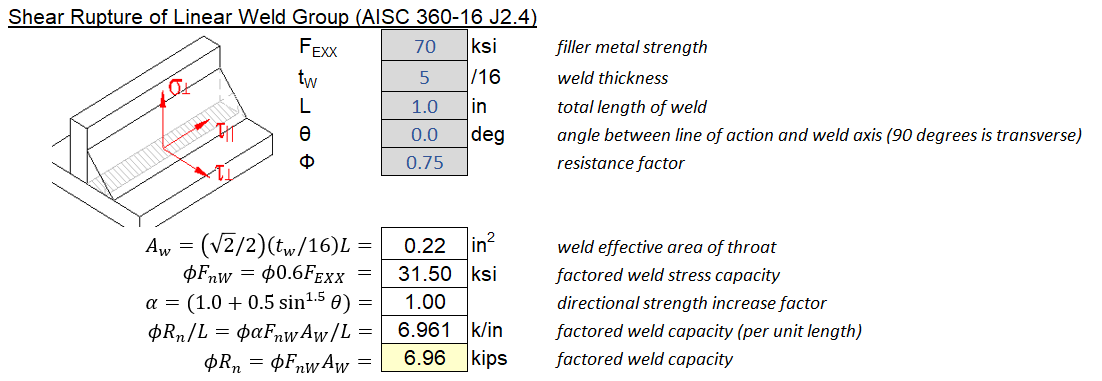
6.2 Weld Shear Rupture Capacity
Regardless of the type of weld, once an effective throat thickness is known, we can calculate weld capacity. It is perhaps useful to reiterate that whether a weld is subjected to tension or shear is irrelevant, all weld fail in shear along the throat dimension.
Weld Metal Shear Capacity (\(\phi=0.75\)):
\[\phi R_n = \phi F_{nw} A_w\]\(F_{nw}\) is the maximum weld stress capacity. \(F_{EXX}\) is the filler metal classification strength, typically 70 ksi is used.
\[\phi F_{nw} = \phi 0.6 F_{EXX}\]\(A_w\) is the area of weld along failure plane. For plug and slot welds, Aw is simply the area of the hole being covered.
\[A_w = t_{throat} \times L_{weld}\]Example Calculation:
Directionality Factor
Transversely loaded welds tend to be stronger than longitudinally loaded weld. A directionality adjustment factor can be calculated to increase capacity by as much as 1.5x:
\[(1.0 + 0.5 sin^{1.5}(\theta)\]Note the above factor is often conservatively taken as 1.0 for more complicated loading scenario where different segment of weld might have different load angles.
The above equation is equal to 1.0 for 0 degrees and 1.5 for 90 degrees. Theoretically, a transverse weld (90 degrees) is 1.5 stronger. This increase in strength comes with a decrease in ductility as shown below.
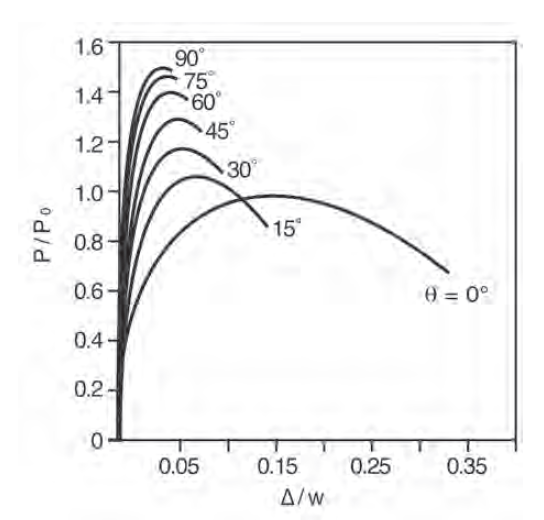
The figure below illustrates the difference between longitudinally and transversely loaded welds.
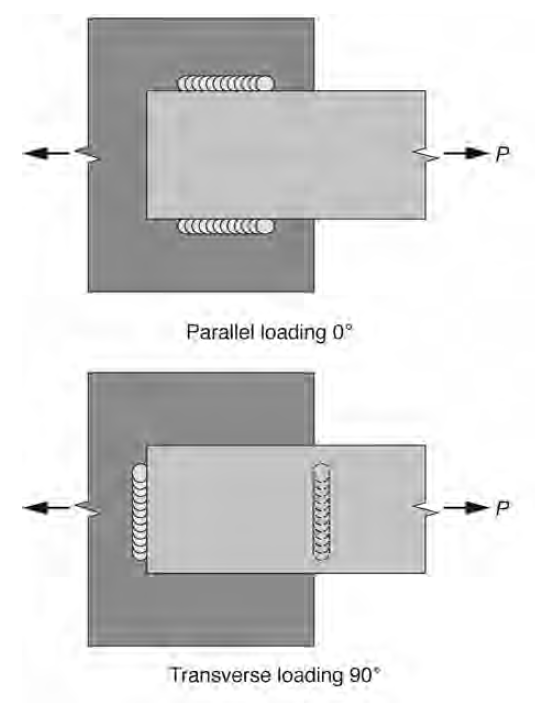
Please note that as of AISC 360-22, this directionality increase is prohibited from being applied to welds on HSS subjected to tension as result of moment T+C couple.
Quick Hand Calculations
For LRFD and 70 ksi filler metal, A longitudinally loaded fillet weld offers 1.392 kips per inch per 1/16” throat thickness
\[\phi F_{nw} = 0.75(0.6)(70) = 31.5 \mbox{ ksi}\] \[\phi F_{nw} = (31.5)(\frac{\sqrt{2}}{2})(1/16)(1) = 1.392 \mbox{ kip/in}\]Therefore, if we need 100 kips of shear capacity and we have a line of 5/16” fillet weld. (5)(1.392) = 6.96 kips. 100/6.96 = 14.4 meaning we need at least 14.4 inches of weld.
In some cases, We just want to provide enough weld to match a base material’s shear rupture capacity (0.6Fu). Using some simple algebra:
- For one-sided fillet:
- For two-sided fillet:
Comments